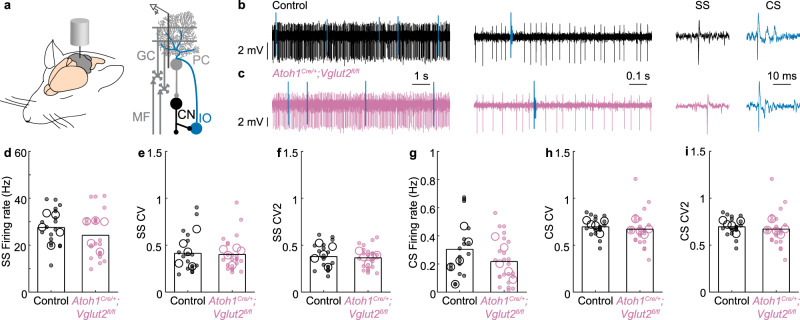
Fig. 6. Purkinje cell firing activity in adult mice.
a Schematic of the in vivo single-unit extracellular Purkinje cell recording setup in anesthetized mice. b Representative trace of a Purkinje cell recording in a control mouse (black and blue lines represent complex spikes). c Representative trace of a Purkinje cell recording in an Atoh1Cre/+;Vglut2fl/fl mouse (reddish purple, blue lines represent complex spikes). In b, c, Inferior olive (IO) evoked a complex spike (CS) in blue. The y-axis is constant across the panel. The x-axes (timescales) are the same for (b, c). d No differences were found in the SS Firing rate (p = 0.490; d = 0.40), e SS CV (spike pattern, p = 0.766; d = 0.07), f SS CV2 (spike regularity, p = 0.659; d = 0.11), g CS Firing rate (p = 0.489, d = 0.49), h CS CV (spike pattern, p = 0.598, d = 0.19), or i CS CV2 (spike regularity, p = 0.246, d = 0.48). For d–i, large open circles represent the mouse average, and small, closed circles represent the cell average. Data points from control mice in black, and data points from Atoh1Cre/+;Vglut2fl/fl mice in reddish purple. A linear mixed model analysis with genotype as a fixed variable and mouse number as a random variable was used to test for statistical significance in (d–i). Control: N = 5 mice, n = 18 cells; Atoh1Cre/+;Vglut2fl/fl: N = 5, n = 23. Source data and detailed statistical results are available and provided as a Source Data file. Panel (a) was adapted from White & Sillitoe, 2017, “Genetic silencing of olivocerebellar synapses causes dystonia-like behavior in mice,” Nature Communications21 under CC BY 4.0.

