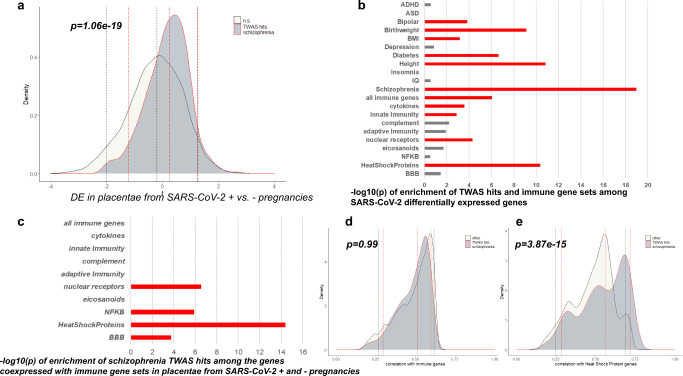
Fig. 6. Placental schizophrenia-risk genes and SARS-CoV-2 infection.
a Density plots of the t-statistics, from the differential expression analysis comparing placentae from SARS-CoV-2 positive (N = 5) and negative (N = 3) pregnancies, of placental schizophrenia-TWAS genes (TWAS hits, dark gray area under solid red curve), and all other genes (under black curve) (negative t-statistics = less expressed in placentae from SARS-CoV-2 positive pregnancies; and positive t-statistics = more expressed in placentae from SARS-CoV-2 positive pregnancies). Bars depict negative logarithm of the P values of the enrichment, from the Wilcoxon geneSetTest, of TWAS hits for developmental disorders and traits, and immune gene sets, among the SARS-CoV-2 differentially expressed genes (b), and of the schizophrenia TWAS hits among the genes coexpressed with immune gene sets (c); orange bars indicate gene sets significantly enriched (p < 0.05) after Bonferroni-correction for multiple comparisons. Density plot of the absolute values of correlation coefficients of placental schizophrenia-risk genes (dark gray area), and all other genes with the immunity genes (d) and the heat-shock protein genes (e). In (a, d, and e) dotted lines depict 95% confidence intervals and median of the moderated t-statistics from the differential expression analysis (a) or the correlation coefficients (d,e) of the placental schizophrenia risk genes (red double-dotted lines) and of all the other genes (black dotted lines); one-sided P value at the top of the graphics are from the Wilcoxon geneSetTest.

