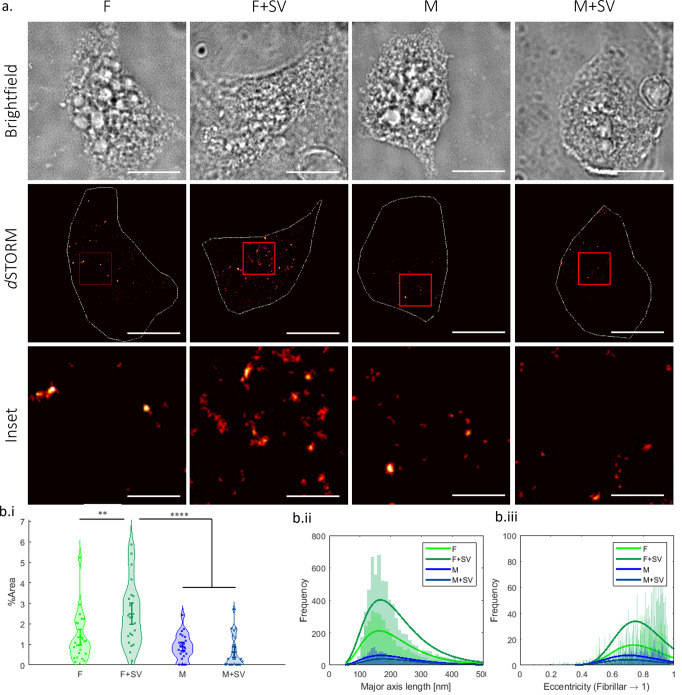
Fig. 1. SV lipid-associated aSyn fibrils are more readily taken up into i3Neurons compared to aSyn only fibrils.
a 500 nM of 10% ATTO647N-labelled aSynC141 and 90% unlabelled WT aSyn as monomer (M) or fibrils (F) +/− SV were incubated with i3Neurons for 1 h before cells were washed, fixed and imaged. Shown are representative brightfield and fluorescence images of i3Neurons containing the different aSyn samples. The brightfield image was used as a reference point to define the edges of the cell soma for quantification of the soma area, highlighted by the white line in the dSTORM images. Scale bar for brightfield and dSTORM images = 10 μm. The insert highlighted by the red box in the dSTORM images shows representative taken up aSyn structures in the soma, scale bar = 2 μm. b.i The taken up aSyn was quantified by the area of fluorescence divided by the area of the soma and is displayed as % area. There was a greater % area of fluorescence in cells that were incubated with sonicated fibrils grown in the presence of SVs (F + SV) compared to fibrils alone (F). There was no significant difference between monomer alone (M) and monomer with SV (M + SV), but less was taken up than for fibrillar aSyn samples. Experiments were repeated three times. A total of 23 cells were analysed per sample, each cell is represented as a point on the graph. A one-way ANOVA with Holm-Šídák tests was performed, F vs F + SV **p < 0.005, F + SV vs M and F + SV vs M + SV ****p < 0.0001. b.ii The quantity and major axis length show that aSyn fibrils grown in the presence of SV have an average major axis length of 179.9 nm and were more readily taken up by i3Neurons compared to fibrils formed alone which had an average length of 182.3 nm (F + SV = 7334, F = 3695). In contrast, more monomeric aSyn alone (M = 1962) was taken up compared to monomeric aSyn and SV (M + SV = 1040) which had average lengths of 187.1 nm and 195.4 nm, respectively. b.iii The eccentricity analysis shows that the fibril samples are more fibrillar in shape compared to monomeric aSyn, F = 0.823, F + SV = 0.831, M = 0.798, M + SV = 0.791. Dye only, SV only and dye with SV were used as controls (Supplementary Fig. 3).

