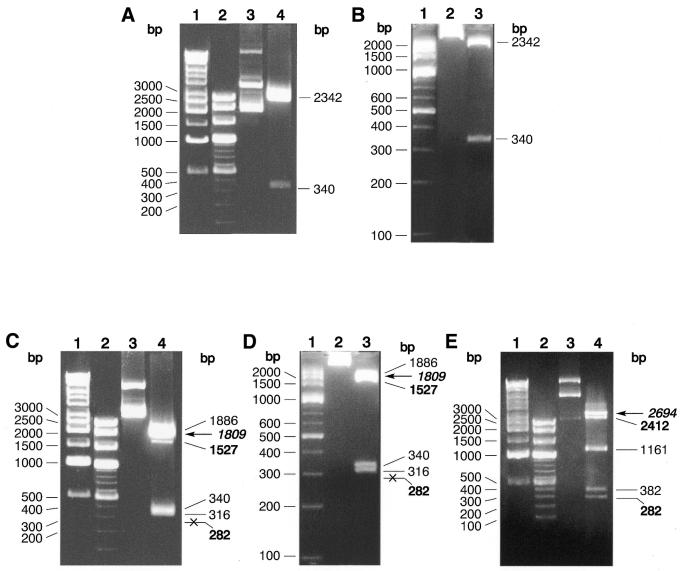
Figure 1.
Digestion pattern and site preference of TspGWI on pUC19, pBR322 and pACYC184 plasmid DNAs. (A) TspGWI cleavage of pUC19 DNA, 1% agarose/TAE. Lane 1, 1 kb ladder; lane 2, 100 bp ladder; lane 3, untreated pUC19 DNA; lane 4, TspGWI-cut pUC19 DNA. (B) TspGWI cleavage of pUC19 DNA, 3.5% NuSieve GTG agarose/TAE. Lane 1, 100 bp ladder; lane 2, untreated pUC19 DNA; lane 3, TspGWI-cut pUC19 DNA. (C) cleavage of pBR322 DNA, 1% agarose/TAE. Lane 1, 1 kb ladder; lane 2, 100 bp ladder; lane 3, untreated pBR322 DNA; lane 4, TspGWI-cut pBR322 DNA. Out of five TspGWI sites in pBR322, one 5′-AACGGAT-3′ variant is cleaved inefficiently, resulting in fragments of 1527 bp (faint band, marked in bold) and 282 bp (not visible on reproduced picture, marked in bold and crossed). The partial digestion band of 1809 is indicated by bold italics and a horizontal arrow. (D) TspGWI cleavage of pBR322 DNA, 3.5% NuSieve GTG agarose/TAE. Lane 1, 100 bp ladder; lane 2, untreated pBR322 DNA; lane 3, TspGWI-cut pBR322 DNA. (E) TspGWI cleavage of pACYC184 DNA, 1% agarose/TAE. Lane 1, 1 kb ladder; lane 2, 100 bp ladder; lane 3, untreated pACYC184 DNA; lane 4, TspGWI-cut pACYC184 DNA. Bands of 2412 and 282 bp, where intensity is decreased due to slow cleavage rate of TspGWI site variant 5′-AACGGAT-3′, are marked in bold. Partial digestion band of 2694 bp is marked in bold italics and a horizontal arrow. Selected band sizes of marker DNAs are shown on the left of each panel.

