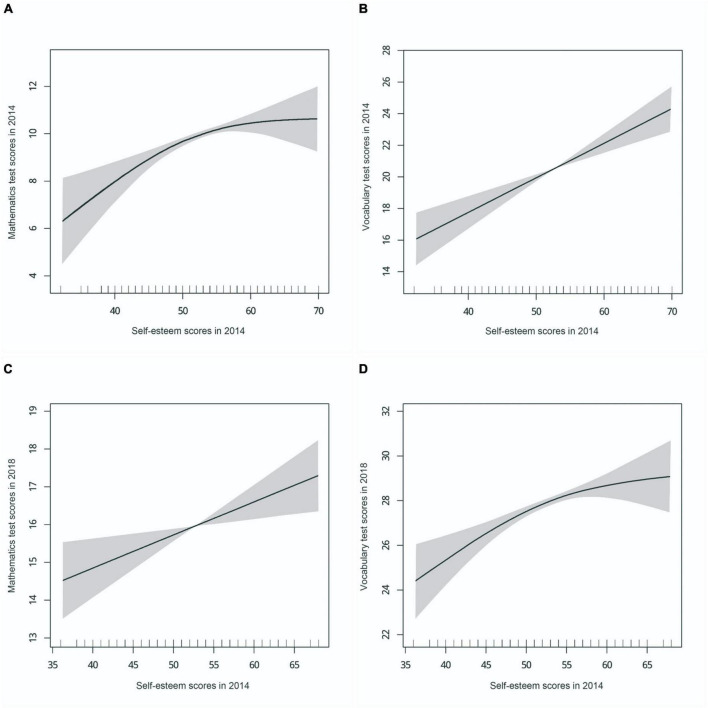
FIGURE 2.
The association of self-esteem in 2014 with cognitive test scores in 2014 and 2018. (A) Association of self-esteem scores in 2014 with mathematics test scores in 2014. (B) Association of self-esteem scores in 2014 with vocabulary test scores in 2014. (C) Association of self-esteem scores in 2014 with mathematics test scores in 2018. (D) Association of self-esteem scores in 2014 with vocabulary test scores in 2018. Adjusted for adolescents’ characteristics (age and gender), parents’ characteristics (maternal age, paternal age, maternal education level, paternal education level, maternal employment status, paternal employment status), and household characteristics (urban–rural location, household per capita income, family size). Solid lines represent the spline curve, and the shaded areas represent the 95% confidence interval of the spline curve.

