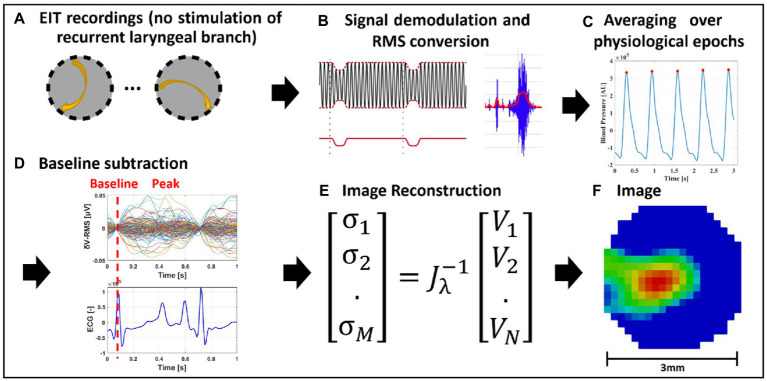
Figure 2.
EIT of spontaneous neural activity. (A) EIT recordings are performed for multiple injection pairs on the cervical vagus nerve cuff. (B) Raw EIT data is demodulated, band-pass filtered and converted to RMS signal (δV-RMS). (C) Coherent averaging of RMS-converted EIT data is performed over epochs of periodic physiological signals (e.g., heartbeat or breathing). (D) Baseline subtraction is performed over δV-RMS traces at a time point corresponding to low or absent neural traffic. (E,F) Tikhonov-based reconstruction is performed to obtain a conductivity map over the cross-section of the nerve. The color scale is arbitrary units (Z score of relative change in the modulus of the impedance).

