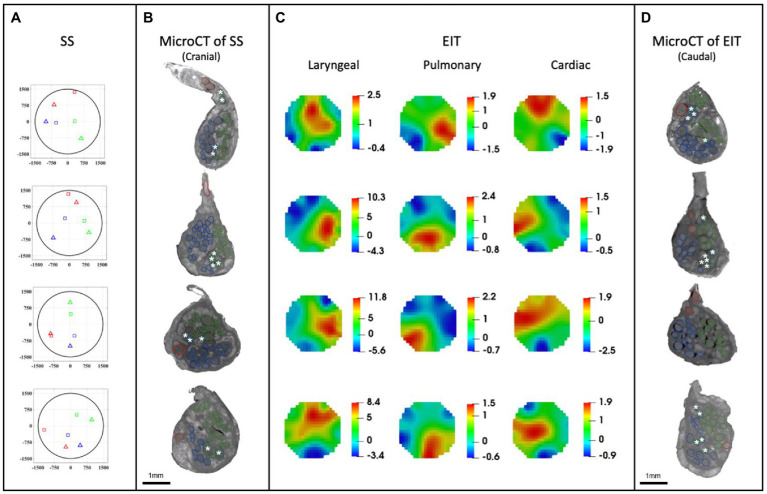
Figure 7.
EIT, SS and microCT results (N = 4) rotated with respect to the cuff opening (top; laryngeal in green, pulmonary in blue, and cardiac in red). (A) Selective stimulation (SS) CoM plots. Triangles = SS, Squares = microCT. For each plot, CoM location identified by SS is reported over a circular cross-section with 3 mm diameter, expressed in figure as ±1,500 μm on both axes. (B) MicroCT cross-sections of the center of SS cuff with segmented fascicles. Merged pulmonary and recurrent laryngeal fiber-containing fascicles are demarcated with a white asterisk. (C) EIT images for each fascicular group in the nerves. The color scale is arbitrary units (Z score of relative change in the modulus of the impedance). (D) MicroCT cross-sections of the center of EIT cuff with segmented fascicles. Merged pulmonary and recurrent laryngeal fascicles are demarcated with a white asterisk. (A–D) rotated with respect to the cuff opening at 12 o’clock which corresponds with the ventral direction in the animal.

