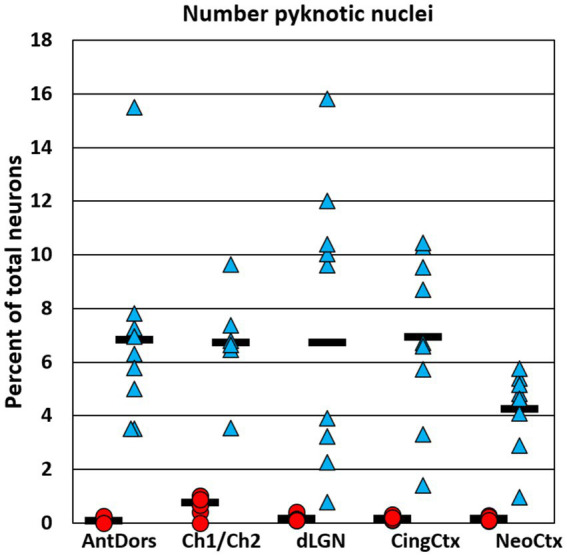
Figure 4.

Graphs show the number of Nissl-stained apoptotic cells in each region, expressed as a percent of the total neuron number. The number of apoptotic cells was estimated in P7 brains at 8 h after the onset of ethanol treatment. In each region ethanol treatment caused a robust increase in the number of apoptotic cells compared to saline controls. However, the percent of total cells identified as apoptotic was only a fraction of the total cumulative neuron loss (see Figure 2), indicating that most neurons that died in response to ethanol have already been cleared and are no longer detectable by this method.
