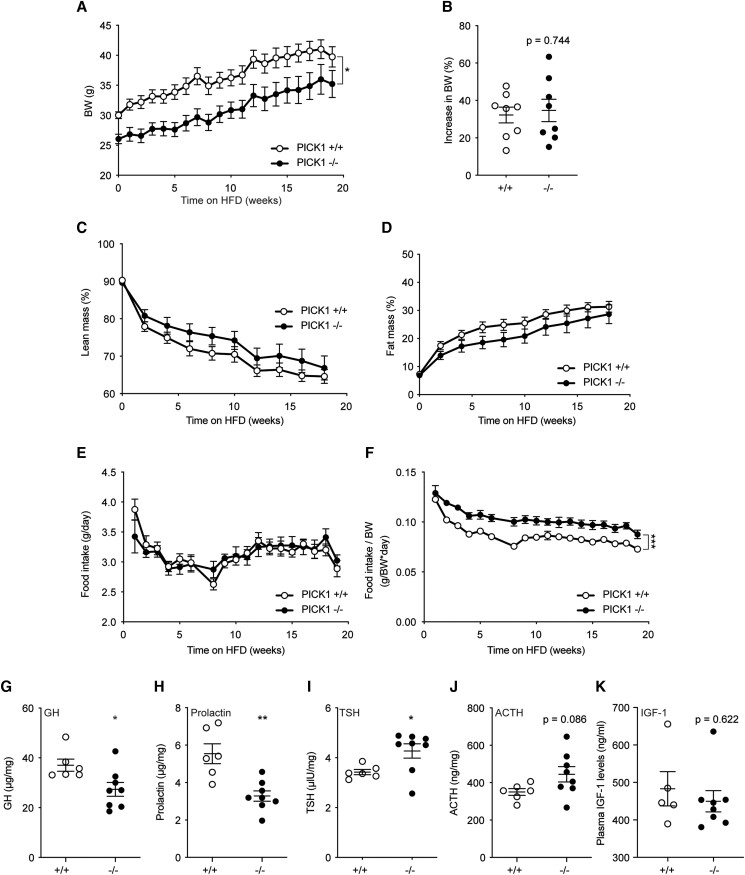
Figure 1.
Total BW and composition of global PICK1-deficient mice on HFD. (A) BW following 18 weeks of HFD and (B) total increase in BW (%). (C, D) Lean and fat mass are shown as the percentage of BW over time, respectively. (E) Food intake over time and (F) relative food intake compared with BW. Data are shown as mean ± SEM (n ≥ 8). (G) GH, (H) prolactin, (I) TSH, and (J) ACTH levels, and (K) plasma IGF-1 from 45-week-old mice following HFD. Data are shown as dot plot with mean ± SEM (n ≥ 5). Statistical significance was determined using 2-way ANOVA with Sidak's multiple comparisons test or unpaired t test. *P < .05, **P < .01, ***P < .001.

