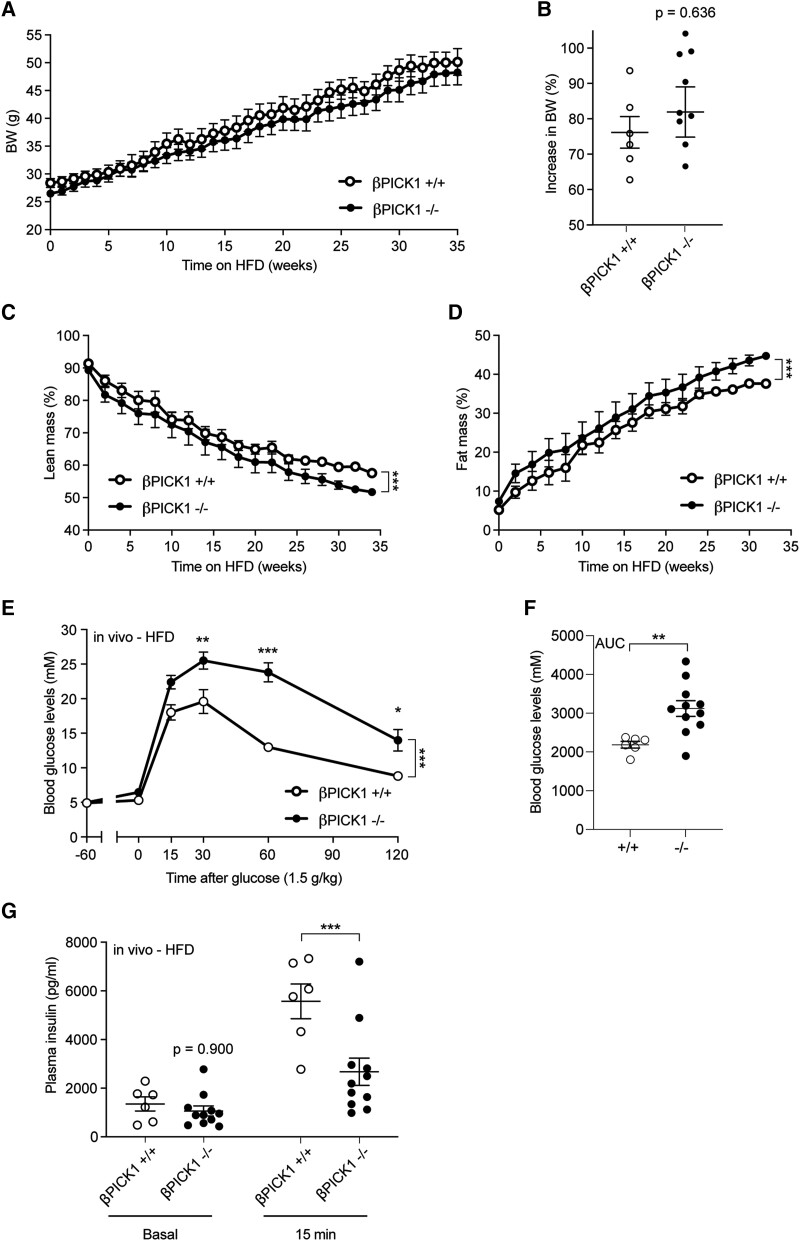
Figure 6.
βPICK1-KO mice show impaired insulin secretion during HFD. (A) BW of βPICK1-KO and WT mice following 35 weeks of HFD (n ≥ 6). (B) Total increase in BW (%) following 35 weeks on HFD (n ≥ 6). (C, D) Fat and lean mass are shown as the percentage of total BW. (E) The OGTT was carried out in fasted mice following HFD. (F) During OGTT insulin was measured −60 (basal) minutes and after 15 minutes. Data are shown as mean ± SEM. Statistical significance was determined using 2-way ANOVA with Sidak's multiple comparisons test. *P < .05, ***P < .001.

