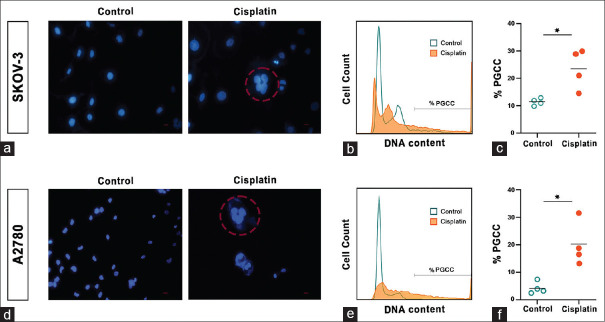
Figure 2.
Augmentation of polyploid cells in SKOV-3 and A2780 cell lines post-cisplatin treatment. (a, d). Fluorescent images of the cells in test and control group (DAPI staining) after 72 hours cisplatin treatment and 7 days recovery. Scale bars: 50 μm. (b, e). DNA content analysis before and after cisplatin treatment. (c, f). The percentage of PGCCs in 4 replicates of each group. * P value < 0.05, black line = Mean. Significance was calculated by unpaired Mann-Whitney t-test

