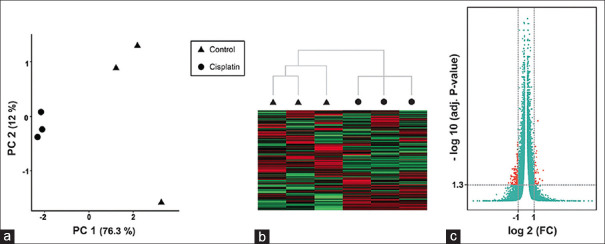
Figure 3.
Quality assessment of the dataset. (a, b). Principal component analysis and hierarchical clustering could successfully separate control and cisplatin treatment groups. (c). The Volcano plot demonstrates the genes with adjusted P value < 0.05 and |log FC| ≥1 considered as DEGs in this study (orange dots)

