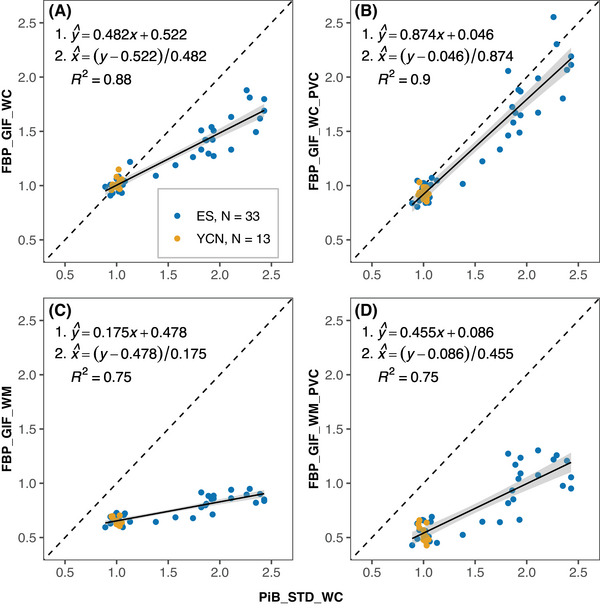
FIGURE 2.

Paired FBP and PiB SUVR data from the Florbetapir Calibration dataset. Plots show the relationship between FBP SUVRs (y‐axis) processed using GIF_WC (A), GIF_WC_PVC (B), GIF_WM (C), and GIF_WM_PVC (D) pipelines and PiB SUVRs with STD_WC processing (all x‐axes). The dashed line represents x = y and the black line is the linear regression fit with gray area representing 95% confidence interval. Conversion equations and R 2 are displayed on the plots. All non‐standard methods exceed the reliability threshold (R 2 > 0.7) set by Klunk et al. 9 and are therefore suitable for Centiloid conversion. ES, elder subjects group; FBP, florbetapir; GIF, Geodesic Information Flows‐based pipeline; PiB, Pittsburgh compound B; PVC, partial volume corrected; STD, standard Centiloid pipeline; SUVR, standardized uptake value ratio; WC, whole cerebellum reference; WM, eroded white matter reference; YCN, young cognitively normal group.
