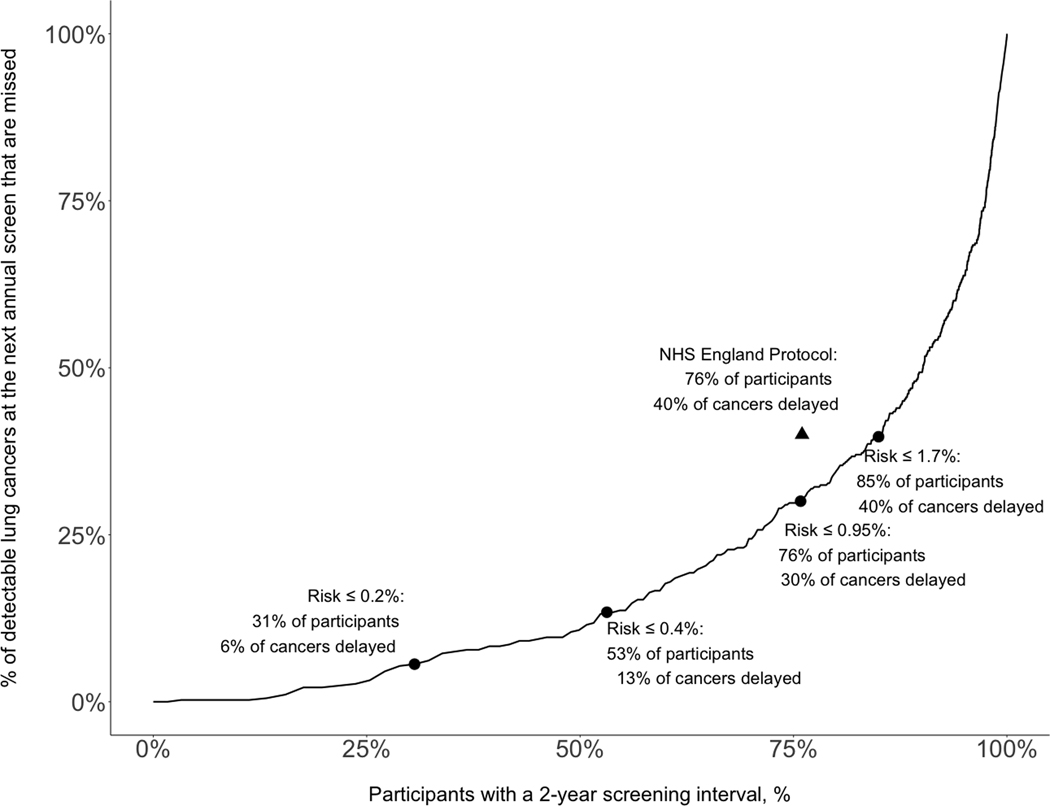
Figure 1: Potential impact of using the full LCRAT+CT risk model to refer the lowest-risk participants for a 2-year screening interval in the National Lung Screening Trial, among participants with any screening result (negative or abnormal).
The figure includes both individuals with a recent abnormal screen, with risks calculated by LCRAT+CTpos as described in the manuscript, as well as individuals with a recent negative screen, whose risks were calculated by LCRAT+CTneg as previously described.13 The triangle represents the performance of the NHS England protocol; because it is not on the line, a risk-based program should be superior. The risk used is cumulative risk of both immediate (denoted ri) and 1-year next-screen risk (rn); then cumulative risk = ri+(1-ri)rn. This cumulative risk expression denotes that each participant begins with immediate risk ri, then for those who do not have immediate cancer (1-ri), they contribute their 1-year next-screen risk (rn). 1-year LCRAT+CT risks were calculated by 10-fold cross-validation, so that no record contributes to its own prediction. The data in this figure are also presented, together with additional information, in Table 4.

