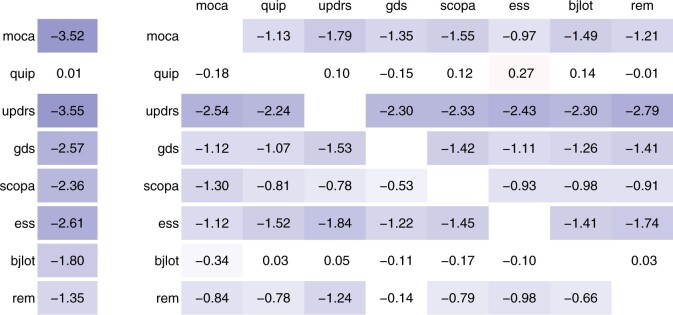
Fig. 3.
Percentage change in cross-validated mean squared error from univariate to multivariate regression. Left: we support the prediction for one tool at one visit with the same tool at other visits. Right: we support the prediction for one tool at one visit (row) with another tool at the same visit (column). All values are averaged across visits (1/2/3), regularization methods (lasso/ridge) and data types (clinical/omics/both), i.e. 18 settings

