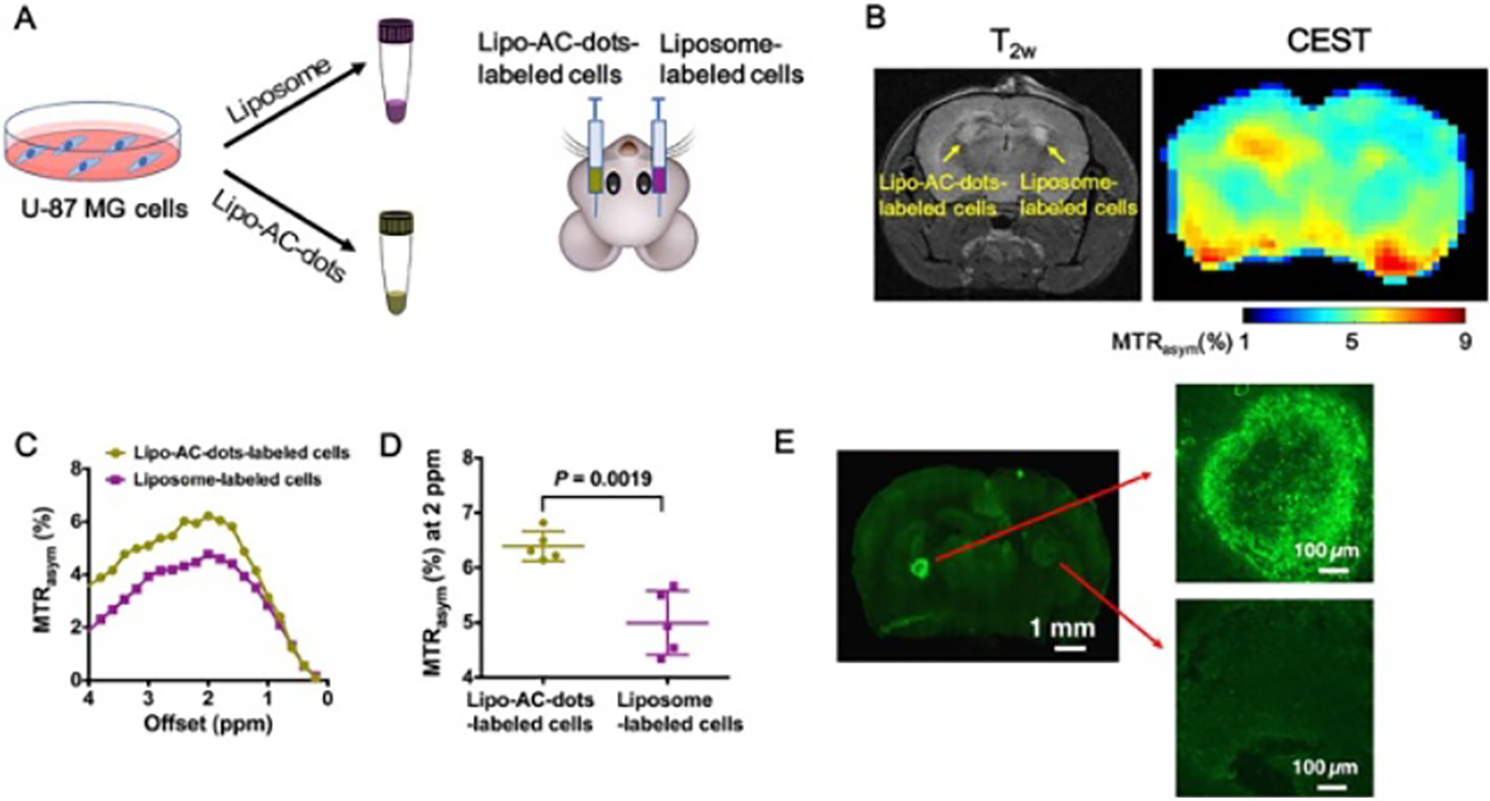
Figure 8.

In vivo CEST MRI of mouse brain 1 d after AC-dots-labeled U-87 MG cells implantation in the striatum. (a) Illustration of the preparation and implantation of Lipo-AC-dots-labeled cells, with empty liposome-labeled cells as the control. (b) T2-weighted image and the corresponding CEST image at 2 ppm of a mouse brain at 24 h after the implantation. (c) MTRasym plots of C-dots-labeled cells and control cells using manually drawn ROIs based on the T2w image. (d) Comparison of CEST contrast at 2 ppm between Lipo-AC-dots-labeled cells and liposome-labeled cells. (e) Ex vivo fluorescence imaging of the brain slice. Excitation wavelength = 495 nm; emission wavelength = 519 nm. Reprinted with permission from [82].
