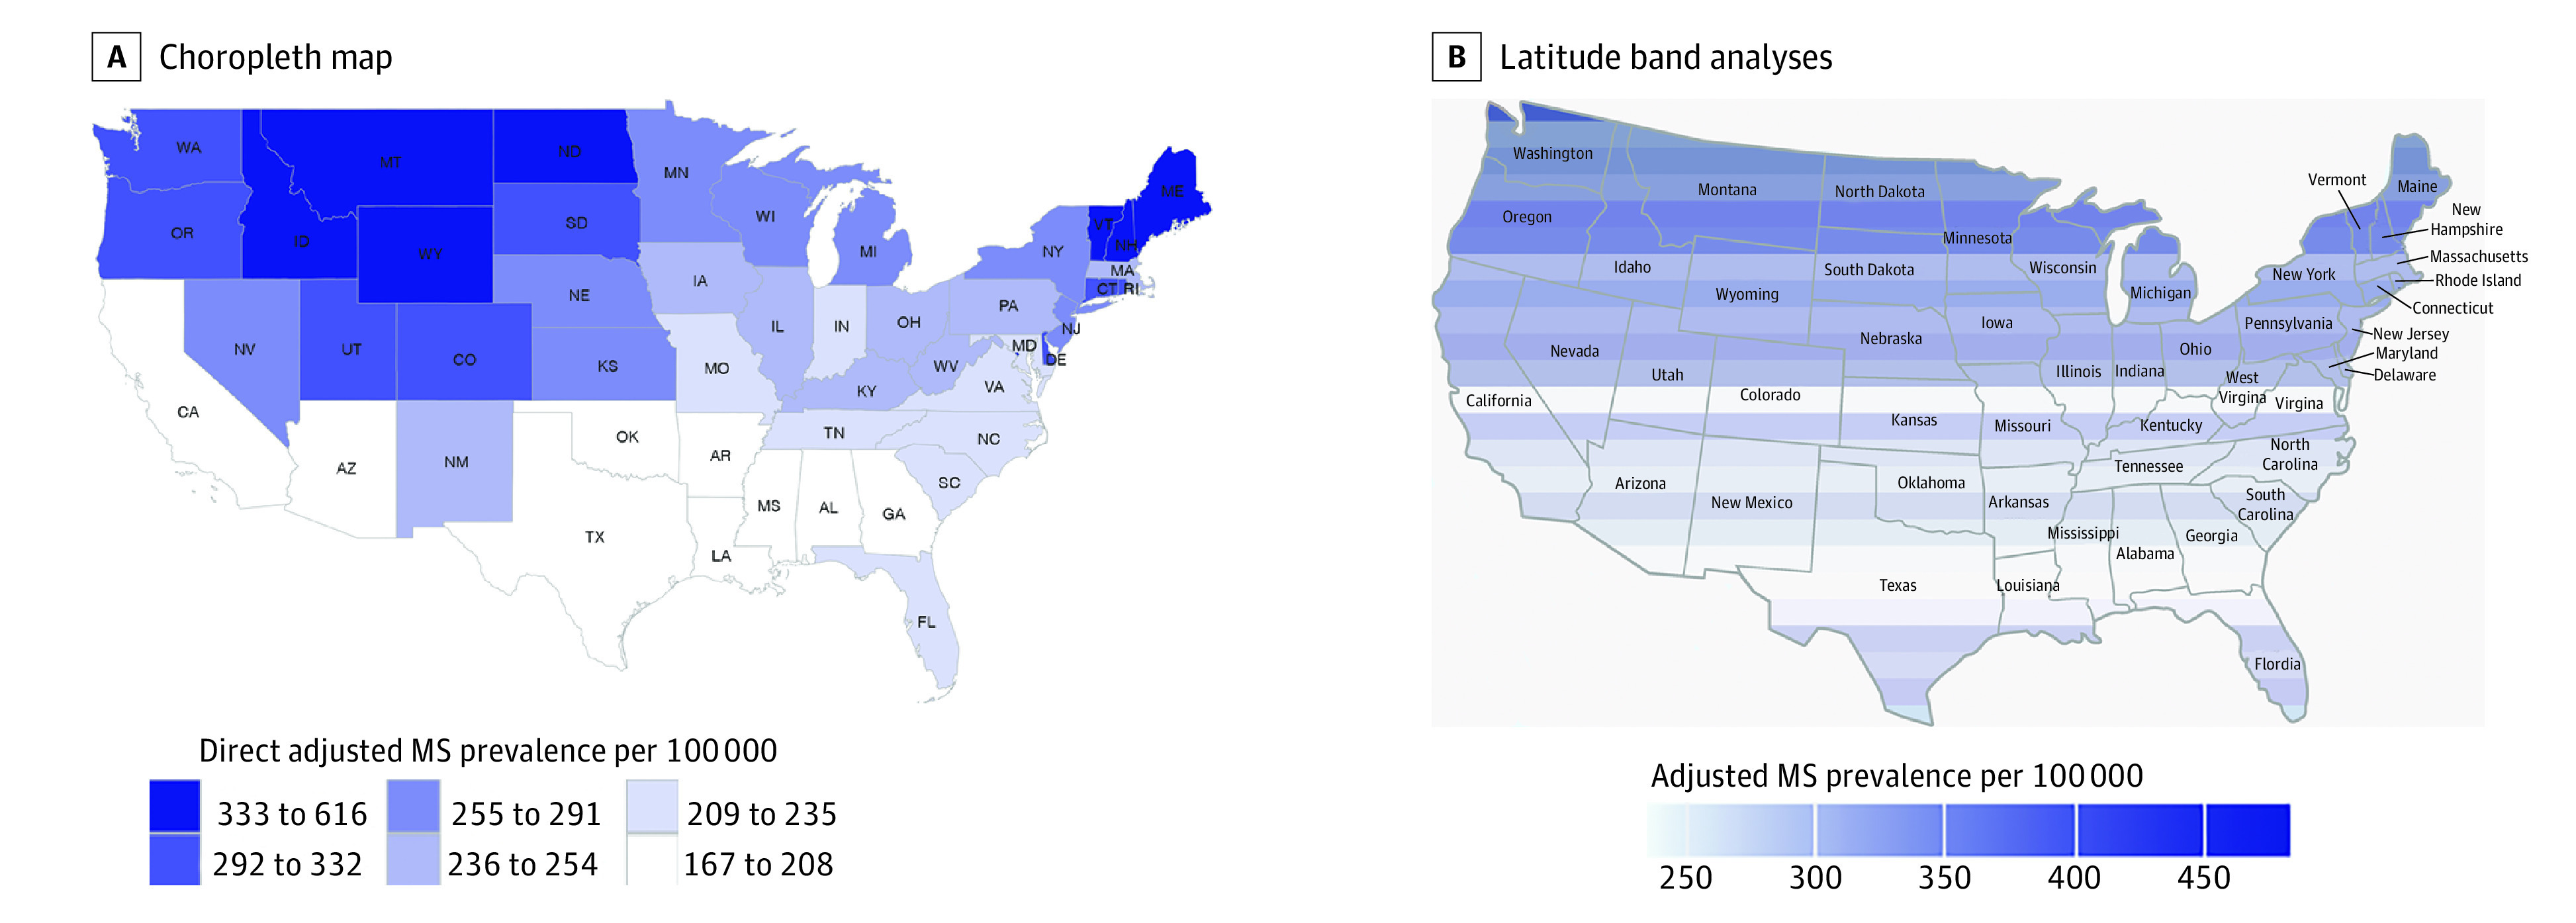
Figure 3. Maps of Direct Age-, Sex-, Race-, and Ethnicity-Adjusted Prevalence of Multiple Sclerosis (MS) per 100 000 Cumulated Over 10 Years by Latitude in the Contiguous United States, 2008-2010.

The choropleth map represents state-aggregated analyses. The latitude band analyses used Optum Clinformatics Data Mart data only.
