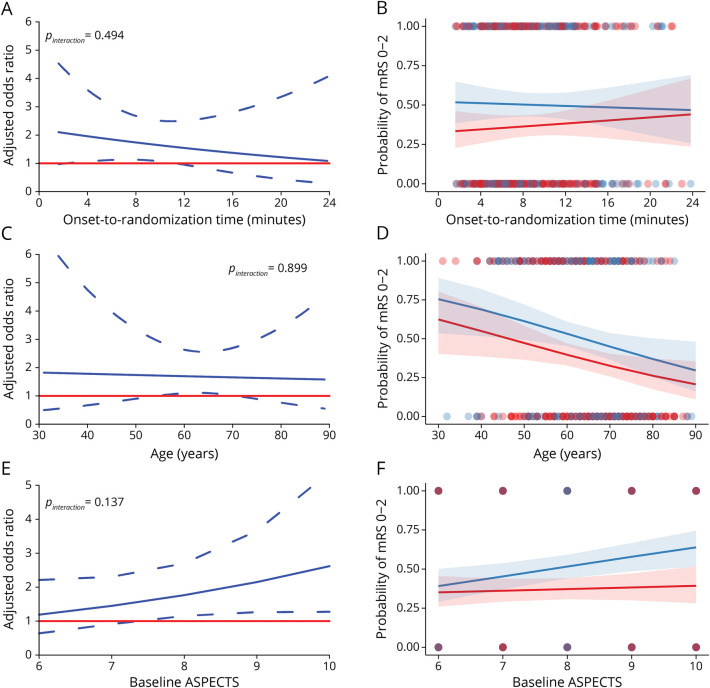
Figure 3. Tirofiban Treatment Effect and Probability of Functional Independence.
The left panels show the treatment effect of tirofiban associated with onset-to-randomization time (A), age (C), and baseline ASPECTS (E). An odds ratio greater than 1 indicates higher odds of functional independence with tirofiban than placebo. The right panels show the probability and 95% CI of functional independence changes with onset-to-randomization (B), age (D), and ASPECTS (F). The blue lines and shading indicate the values in the tirofiban group while the red lines and shading indicate the values in the placebo group. The analyses are based on all patients with atherosclerotic etiology in the RESCUE BT trial. ASPECTS = Alberta Stroke Program Early CT Score.

