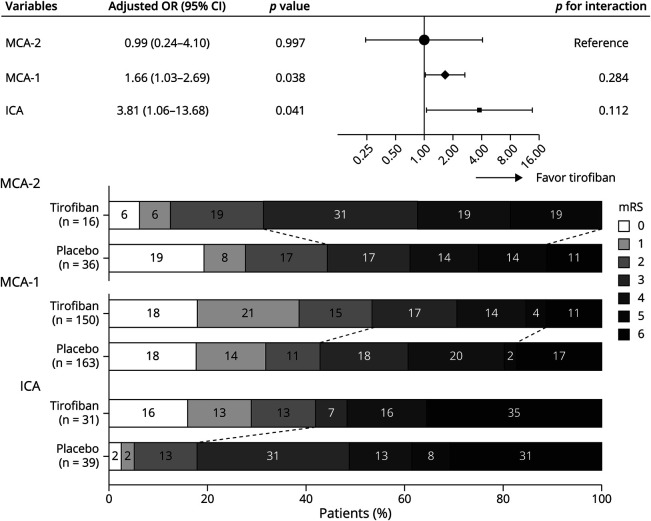
Figure 4. Association Between Treatment With Functional Independence at 90 Days by Location of Occlusion.
Reported ORs are adjusted for age, pretreatment systolic blood pressure, history of diabetes, baseline NIH Stroke Scale, and Alberta Stroke Program Early CT Score. The distribution of the mRS scores in the 2 treatment arms are also shown. ICA = internal carotid artery; MCA = middle cerebral artery; mRS = modified Rankin scale; OR = odds ratio.

