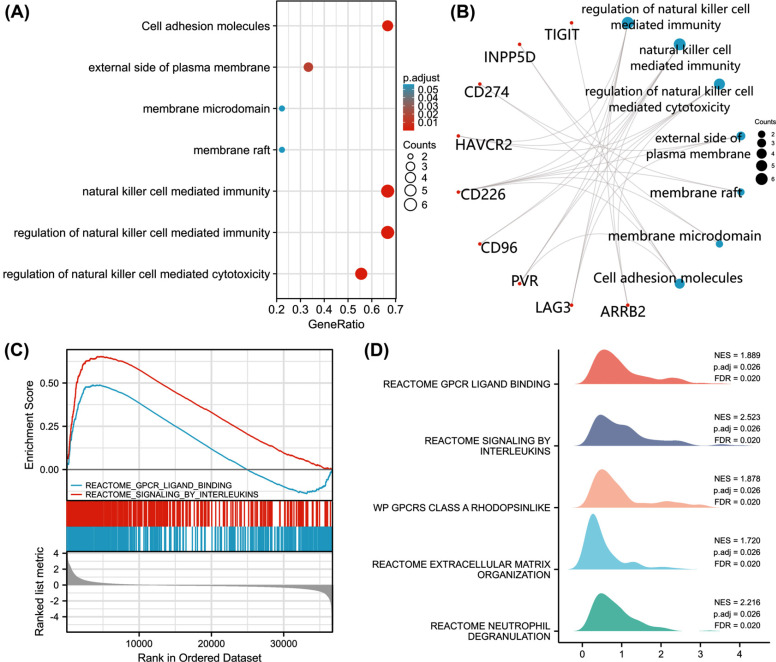
Fig. (7).
Enrichment analyses of TIGIT. (A) The bubble plot shows the signaling pathway of TIGIT; (B) TIGIT, INPP5D, CD274, CD226 and PVR were correlated in cell adhesion molecules; (C-D) enrichment map of GSEA gene set of reactome GPCR ligand binding and reactome siginaling by interleulcins in patients with TIGIT overexpression invasive breast cancer.

