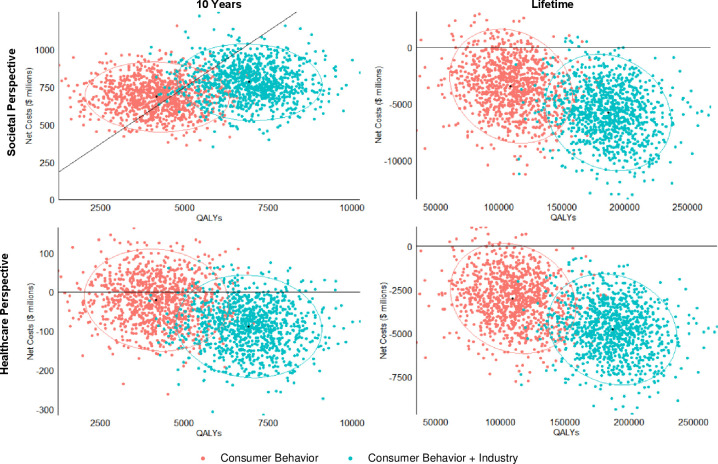
Figure 2.
Probabilistic sensitivity analyses for cost-effectiveness of the federal menu calorie labelling project over 10 years and a lifetime. Values are presented in cost-effectiveness planes of net costs ($millions) versus incremental quality-adjusted life years (QALYs). For each policy scenario, each coloured dot represents one of the 1000 simulations, with the largest dot showing the median incremental cost-effectiveness ratio (ICER, US$/QALY); and the ellipse representing the 95% uncertainty intervals. Results are presented from the societal perspective and the healthcare perspective. Negative values indicate cost savings.

