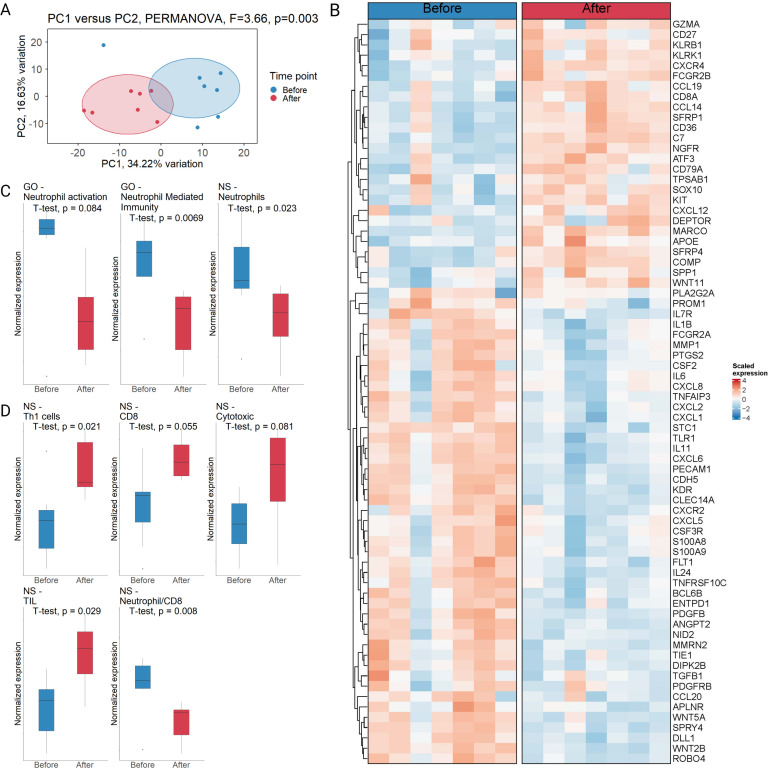
Figure 2.
Changes in the tumor microenvironment after intratumoral influenza vaccine treatment. (A) Principal component analysis based on the top 400 most variable genes from nCounter IO360 panel, which includes 750 genes typically associated with tumor microenvironment biology. The statistical significance was tested using a PERMANOVA on the centroid differences between time points (n=7). (B) Heatmap of paired differentially expressed genes compared between time points (n=7, same order of patients before and after). (C, D) Significant pathways identified using functional enrichment score analysis. Here, the normalized expression of all represented genes in a pathway are analyzed via a paired t-test comparing before and after vaccination tumor samples. Normalized expression depicted as boxplot showing median, upper and lower quartiles (n=7) Whiskers extend into a max of 1.5 times the IQR. EMT, epithelial to mesenchymal transition; GO, Gene Ontology; NS, NanoString; PERMANOVA, permutational multivariate analysis of variance using distance matrices; TIL, tumor-infiltrating lymphocytes.

