Figure 3.
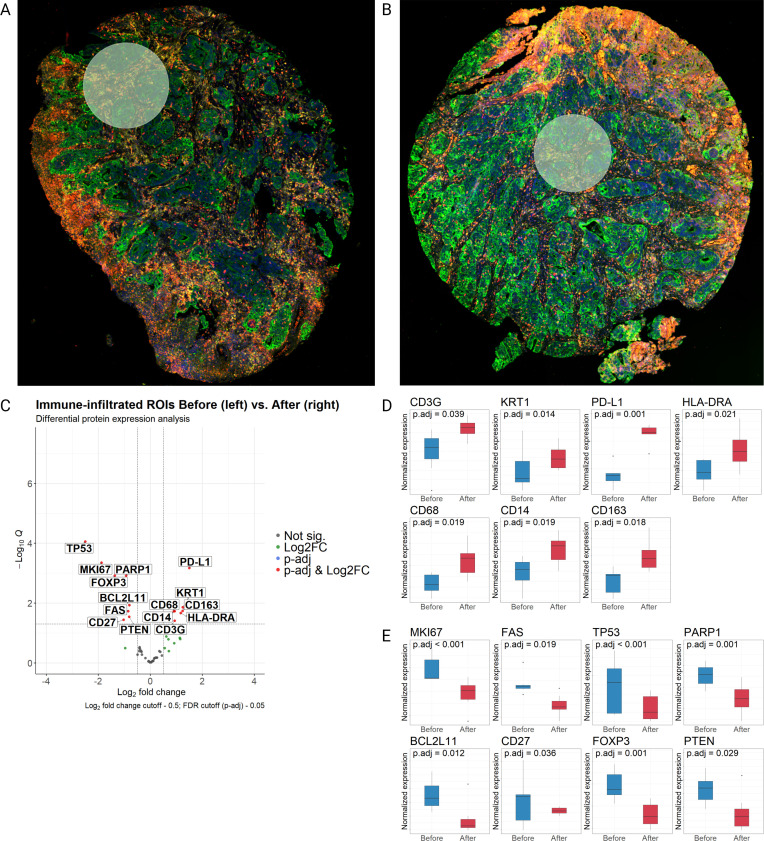
Spatial protein analysis within immune-infiltrated regions of tumors before and after intratumoral influenza vaccine treatment. (A, B) Picture of region of interest (ROI) selection in a patient before (A) and after (B) IT influenza vaccination. ROIs were drawn by a gastrointestinal pathologist and based on infiltration of CD45+ (yellow) and CD8+ (red) cells in areas of Pan-CK (green) and DNA (blue) positive regions. (C) Volcano plot of differentially expressed proteins in ROIs of immune-infiltrated regions of tumors before versus after vaccination (n=7). (D, E) Box plots of differentially expressed proteins upregulated (D), and downregulated (E) after vaccination (n=7). Differential expression of proteins depicted as boxplots showing median, upper and lower quartiles. Whiskers extend into a max of 1.5 times the IQR.FDR: False Discovery Rate; HLA-DRA, Human Leukocyte Antigen DR alpha chain; IT, intratumoral; KRT1, keratin 1; logFC, log2 fold change; MKI67, marker Ki-67; PD-L1, programmed death-ligand 1.

