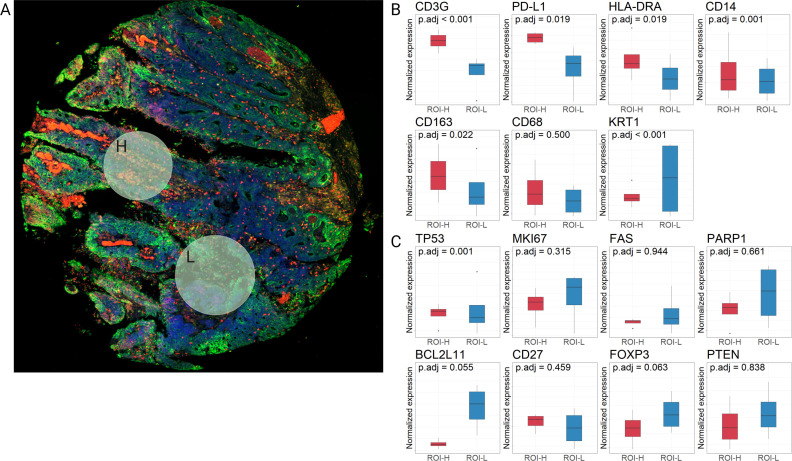
Figure 4.
Spatial analysis of high immune-infiltrated versus low immune-infiltrated regions of tumors after vaccination. (A) Pictures of region of interest (ROI) selection in a patient after vaccination. Upper ROI designates a tumor area with high immune-infiltration (ROI-H) while the lower ROI designates a tumor area with low immune-infiltration (ROI-L). (B) Box plots of differentially expressed (DE) proteins upregulated on vaccination (from figure 3 (n=4)). (C) Box plots of the downregulated DE proteins on vaccination (from figure 3 (n=4)). Differential expression of proteins depicted as boxplots showing median, upper and lower quartiles. Whiskers extend into a max of 1.5 times the IQR. HLA-DRA, Human Leukocyte Antigen DR alpha chain; KRT1, keratin 1; MKI67, marker Ki-67; PD-L1, programmed death-ligand 1.

