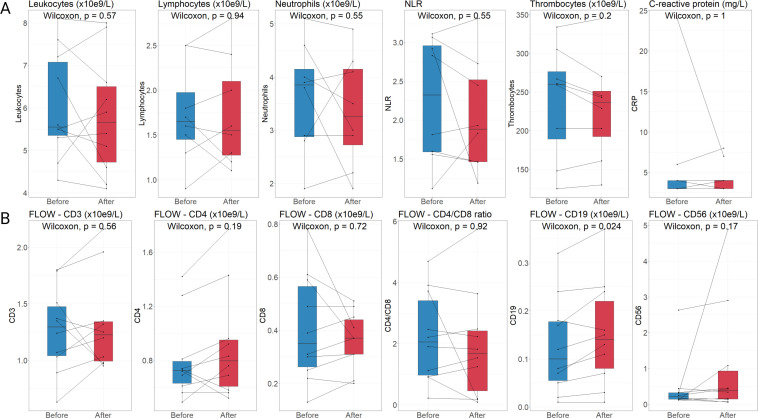
Figure 5.
Circulating levels of immune cells and C-reactive protein after vaccination. (A) Overview of general immune cell populations (leukocytes (n=10), lymphocytes (n=8), neutrophils (n=8), neutrophils/lymphocytes ratio (n=8), and thrombocytes (n=8)), and the concentration of C-reactive protein (CRP, n=9). (B) Overview of flow cytometry analyses to determine subpopulations (CD3+T cells, CD4+T cells, CD8+T cells, B cells (CD19+), and natural killer cells (CD56+), all n=10). Concentration of immune cells and CRP depicted as boxplots showing median, upper and lower quartiles. Whiskers extend into a max of 1.5 times the IQR.

