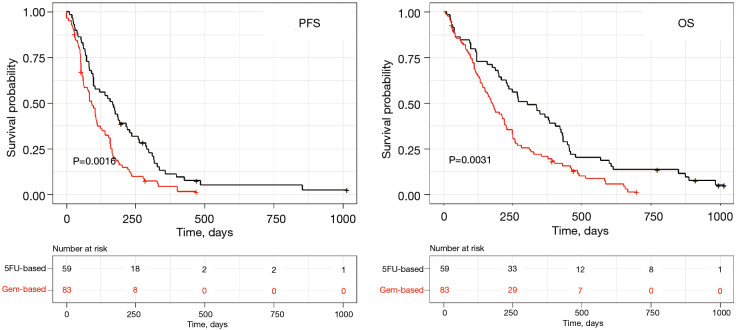
Figure 2.
Kaplan-Meier plots for PDAC patients gemcitabine-based and 5FU-based regimens. Kaplan-Meier plots for both PFS and OS. The red curve identifies the gem-based patients. The black curve identifies the 5FU-based patients. The x-axis represents the number of days. PFS, progression free survival; OS, overall survival; PDAC, pancreatic ductal adenocarcinoma; 5FU, 5-fluorouracil.

