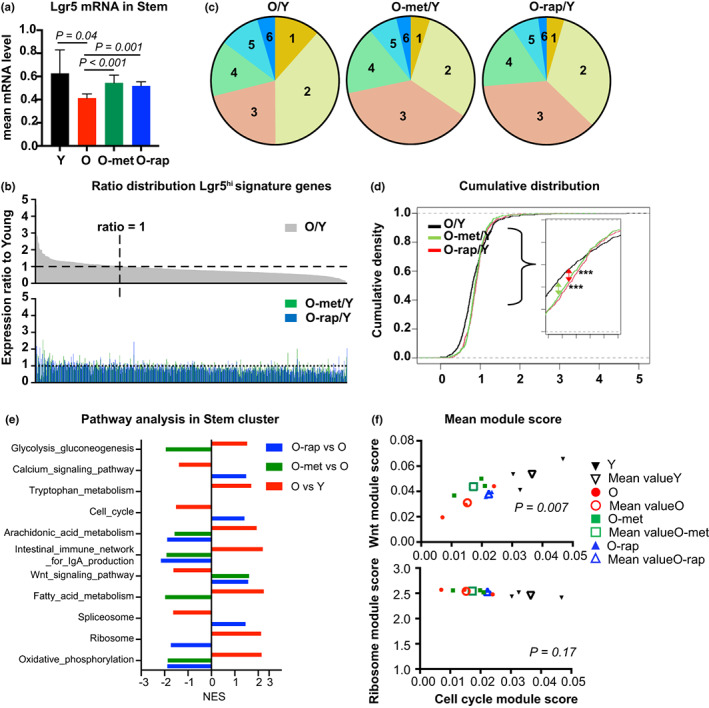
FIGURE 2.

Impact of aging on function of intestinal stem cells: (a) average mRNA expression of the Lgr5 genes in the Stem cluster. (b) Expression ratio of old vs young of 467 genes of an Lgr5hi ISC signature (Muñoz et al., 2012), and corresponding ratio of old‐met vs young or old‐rap vs young (lower panel). (c) Distribution of genes as a function of the ratio of expression; corresponding ratios in Table 1. (d) Cumulative density graph of ratio distribution. Statistical analysis was performed using the Kolmogorov–Smirnov test between two groups (***: p < 0.001). (e) Differentially‐regulated pathways (P adj <0.05) in the stem cluster using GSEA KEGG pathways; NES—normalized enrichment score. (f) Scatter plot for two variables with mean module score. Mean module scores from each mouse (filled) or each condition (empty, average value) were plotted for Wnt and cell cycle pathways (top) or ribosome and cell cycle pathways (bottom). p value was calculated using MANOVA, assuming each mouse as independent.
