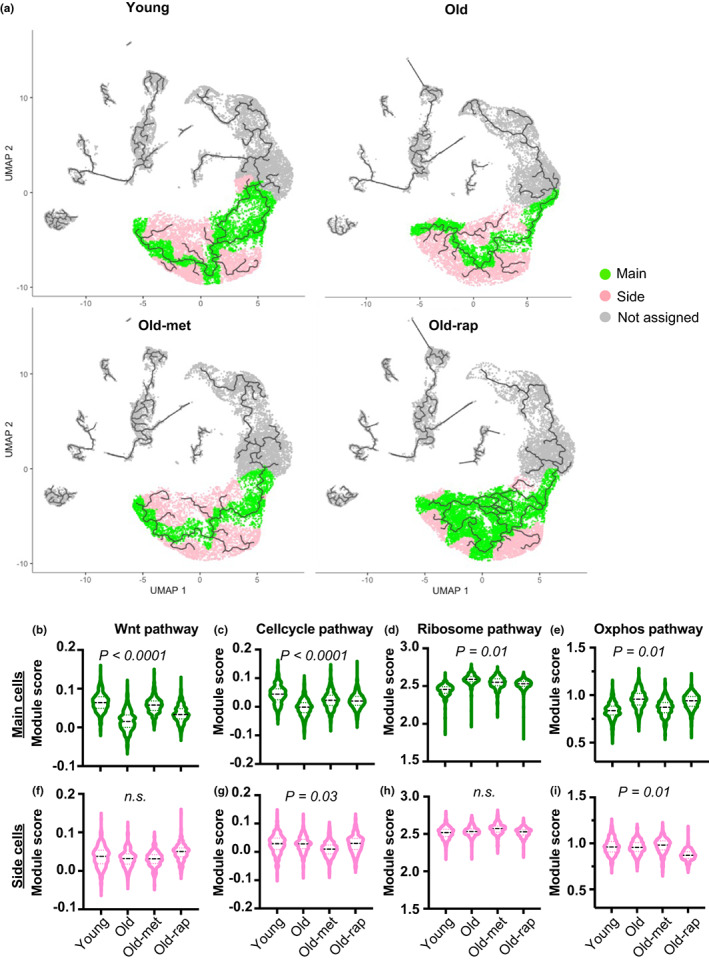
FIGURE 3.

Impact of aging on stem cells differs depending on the position along the trajectory: (a) trajectory graph for each condition. Based on the position of each cell along the trajectory, cells on main track color‐coded green, and cells on side branches color‐coded pink. Cells not included in the analysis are color‐coded gray. (b–i) Module scores of four different pathways plotted separately by position (main: b–e, side: f–i) on the track and condition. Statistical significance was determined by the ANOVA test and applied for each position separately.
