
FIGURE 5.
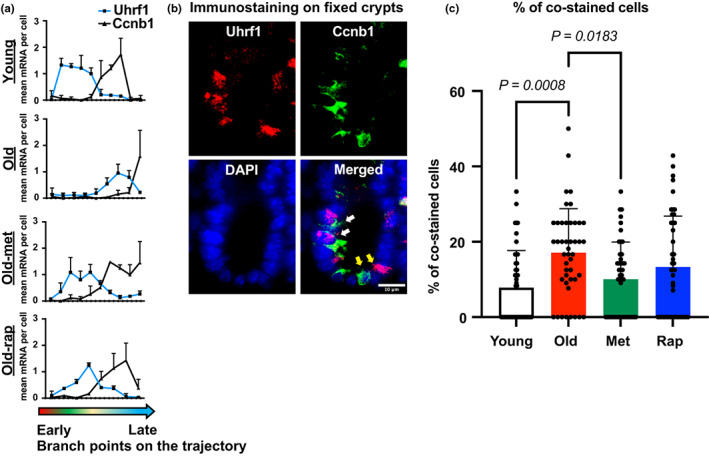
Retardation of developmental trajectory is reflected in cell maturation process: (a) mean mRNA expression of Uhrf1 and Ccnb1, which expression level changes along with developmental trajectory. (b) Representative images of IF for proteins encoded by Uhrf1 or Ccnb1 in FFPE tissues. Images show cells stained with either protein alone (yellow arrows) or cells co‐stained for both proteins (white arrows). Scale bar: 10 μm. (c) Quantitation of co‐stained cells in each condition. 15 crypts were analyzed from 3 mice of each condition. Statistical analysis was performed using one‐way ANOVA followed by Tukey's multiple comparison.