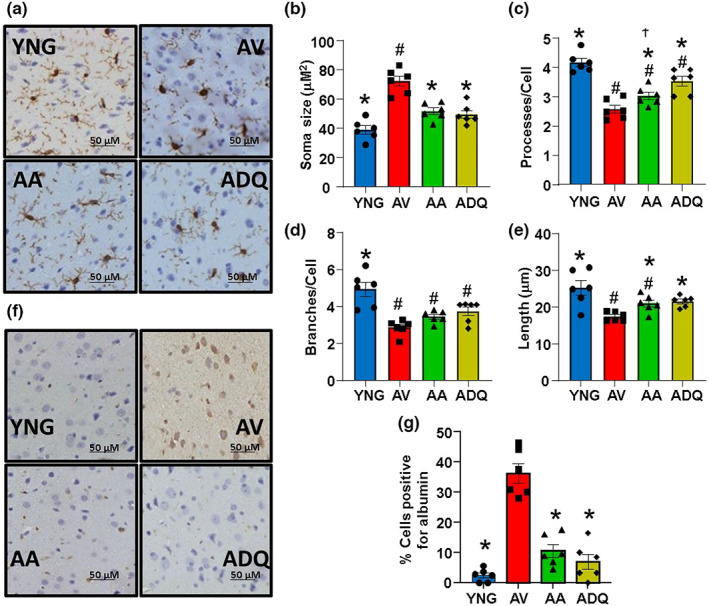
FIGURE 6.

Senolytic treatment reduces age‐associated microglial activation. (a) Representative cortex sections immunohistologically stained for iba‐1. Mean ± SEM for microglial morphological parameters (b) soma size, (c) processes per cell, (d) branches per cell, and (e) the average length of the process. (f) Representative cortex sections immunohistologically stained for albumin. (g) Bars represent mean ± SEM. Asterisks indicate a difference relative to AV, # denotes a difference relative to YNG, and Ϯ indicates a difference relative to ADQ (p < 0.05).
