
FIGURE 1.
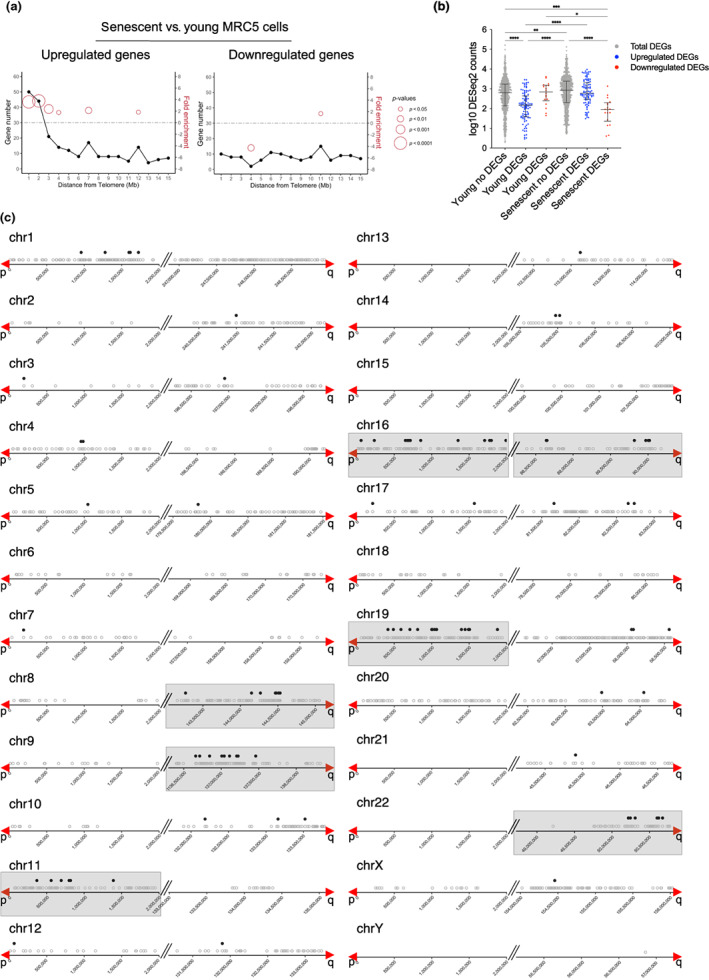
Distribution of DEGs at senescence. (a) Distribution of DEGs in senescent (PD 71) versus young (PD 30) MRC‐5 cells. Upregulated (left) and downregulated (right) genes are shown. The line plots illustrate the number of DEGs related to their distance to telomeres in 1 Mb intervals. Fold enrichment (right Y‐axis) is only shown if there is a significant p‐value and the size of the circles corresponds to the p‐value of the enrichment obtained by a hypergeometric test. (b) Dot plot of DESeq2 normalized counts from the first 2 Mb of telomeres. Counts from non‐differentially expressed genes (no DEGs) and from DEGs in the two conditions (young and senescent) are plotted. Upregulated DEG counts are plotted in blue and downregulated DEG counts are plotted in red. Data represent median with interquartile range of three biological replicates. Statistical analyses were performed using the Kruskal–Wallis test, (*p < 0.05; **p < 0.001; ***p < 0.0001; ****p < 0.00001). (c) Upregulated genes in the first 2 Mb from telomeres. The grey empty dots represent all protein‐coding genes and pseudogenes. The black dots represent upregulated genes (senescent versus young MRC‐5 cells) from this work. The red arrows mark the start of the telomere. The grey boxes delimitate the subtelomeres that are significantly enriched in upregulated genes.