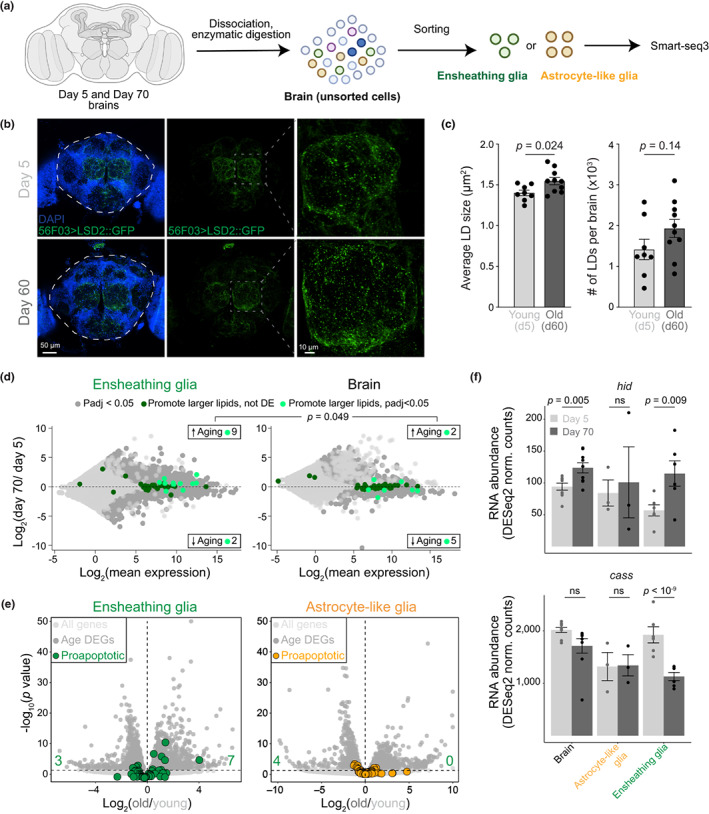
FIGURE 2.

Changes in lipid metabolism and apoptosis in old ensheathing glia. (a) Experimental scheme. Created with BioRender.com. (b) Projections of confocal Z‐stacks from whole mount brains of 5‐day‐old (top) and 60‐day‐old flies (bottom) expressing the LD marker, LSD2::GFP from the ensheathing glia driver GMR56F03. DAPI staining was used to visualize nuclei. The dashed white lines indicate the central brain region used for quantification in (c). Panels to the right show a zoomed‐in image of the region in the dashed gray box. (c) Quantification of size (left) and number (right) of 56F03 > LSD2::GFP foci in the central brains of young (Day 5) and old (Day 60) flies. Points represent individual brains. Bars show mean ± SEM. p values are from Student's t tests. (d) MA plots showing transcriptional differences between ensheathing glia (left) or whole brains (right) from 5‐ and 70‐day‐old flies, combining data from both driver lines (56F03 and 86E01). Genes that promote accumulation of large LDs (Guo et al., 2008) are highlighted in dark green; genes differentially expressed in each tissue (adjusted p < 0.05) are in light green. The enrichment of upregulated lipid promoting genes in old ensheathing glia (9/11) compared to old brain (2/7) was significant (p = 0.049) according to a Fisher's exact test. (e) Volcano plots showing differential gene expression in young and old ensheathing glia (left) or astrocytes (right). Differentially expressed genes (adjusted p < 0.05) are in dark gray; all others are in light gray. Genes annotated as “positive regulators of apoptosis” are highlighted in color. (f) Expression (normalized counts) of hid and cass in the whole brain, sorted astrocyte‐like glia, and sorted ensheathing glia in young and old flies. Bars show the mean ± SEM. p values are from Student's t tests.
