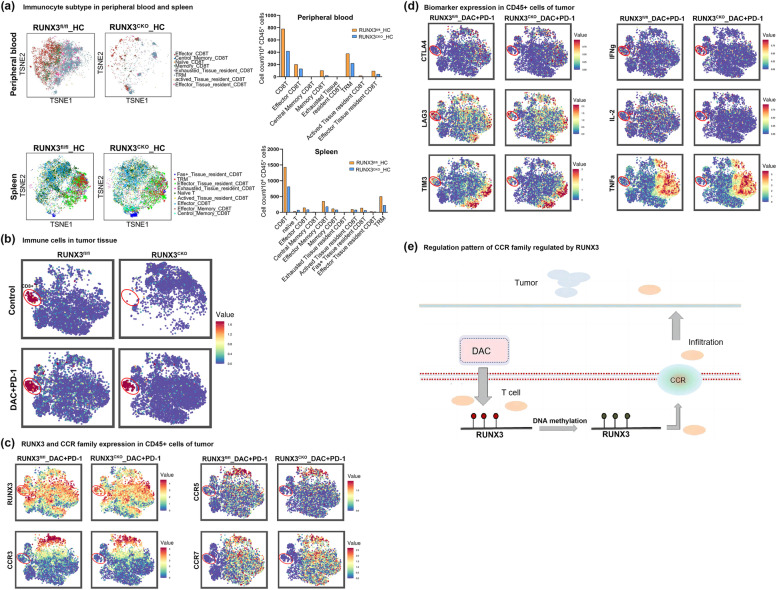
Fig. 5.
Runx3 deletion hampers CCRs expression and tumor infiltration of CD8+ T cells. a Determination of immune cell subsets in the peripheral blood and spleen of Runx3fl/fl and Runx3fl/fl;Lck-Cre (Runx3CKO)mice by tSNE analysis after mass cytometry. Left panel: tSNE data showing the overall distribution of each subgroup. Right panel: The histogram shows the absolute numbers of cells of various subtypes (cell number/104 CD45+ cells). b CD8+ T cells distribution in the tumor tissue of Runx3fl/fl and Runx3CKO mice by tSNE analysis. c tSNE plots showing Runx3 and CCRs expression of T cells after anti-PD-1/DAC treatment. The plots represented CD45+ immune cells in mice tumors, and the circle indicated CD8+ T cell population. d tSNE plots showing expression of marker genes of T cells after anti-PD-1/DAC treatment. The plots represented CD45+ immune cells in mice tumors, and the circle indicated CD8+ T cell population. e Schematic illustration showing that demethylation of Runx3 by DAC promoted CCRs expression and T-cell infiltration

