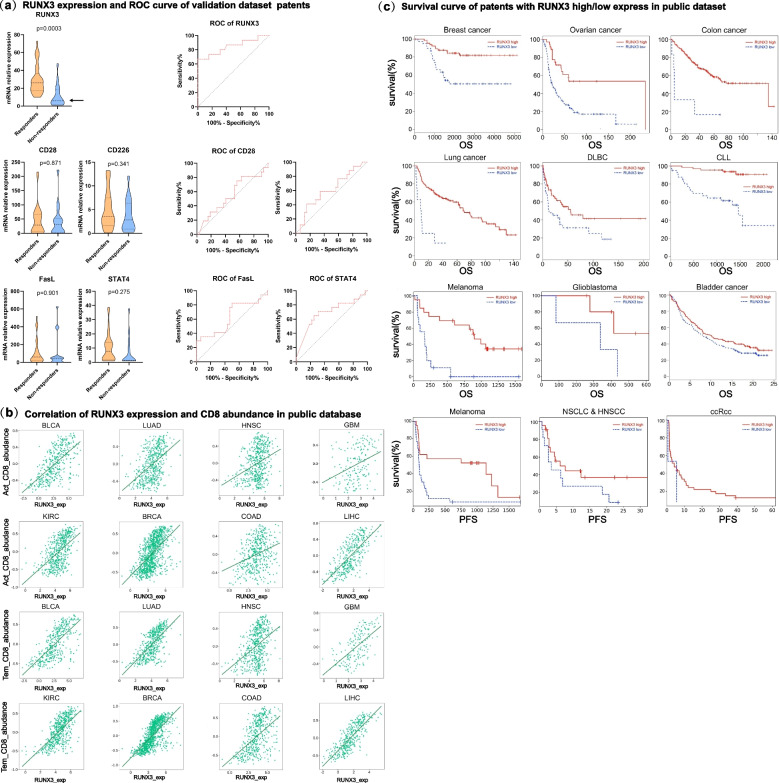
Fig. 6.
Runx3 is a key molecular marker of the clinical response to immunotherapy. a Violin diagram showing the expression levels of Runx3, CD28, CD226, FasL and STAT4 in T cells in responders and nonresponders. The figure shows the median, upper quartile and lower quartile. Two-tailed unpaired t tests. b Correlation analysis between effector T cells, memory T cells and Runx3. The x-axis represents Runx3 expression in T cells, and the y-axis represents the abundance of memory T cells or effector T cells. c. Kaplan‒Meier survival curves between high and low expression of Runx3 in T cells and prognoses in different cancer types

