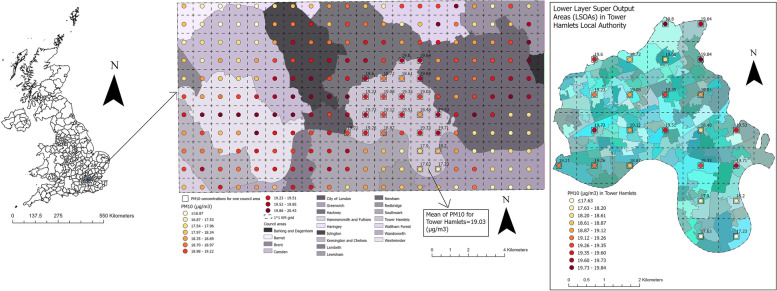
Fig. 2.
A map showing the local authorities in the UK and an enlarged subset of 20 local authorities in the south-east of the UK with an example of PM10 concentrations at 1 × 1 km2 grid for the year 2017 for Tower Hamlets local authority and its corresponding LSOAs. The green–blue coloured polygons in the LSOAs map represent the LSOAs; The map was constructed by the authors in ArcGIS Pro software using PM10 air pollution shapefile for the year of 2017 downloaded from the DEFRA online data repository [44], local authorities UK boundaries shapefile downloaded from the Office for National Statistics [45], and LSOAs and data zones UK boundaries also downloaded from the Office for National Statistics, National Records of Scotland, and Northern Ireland Statistics [46]. Both DEFRA and Office for National Statistics shapefiles are governed under the Open Government Licence v.3.0

