. 2023 Jan 30;5(10):2674–2723. doi: 10.1039/d2na00534d

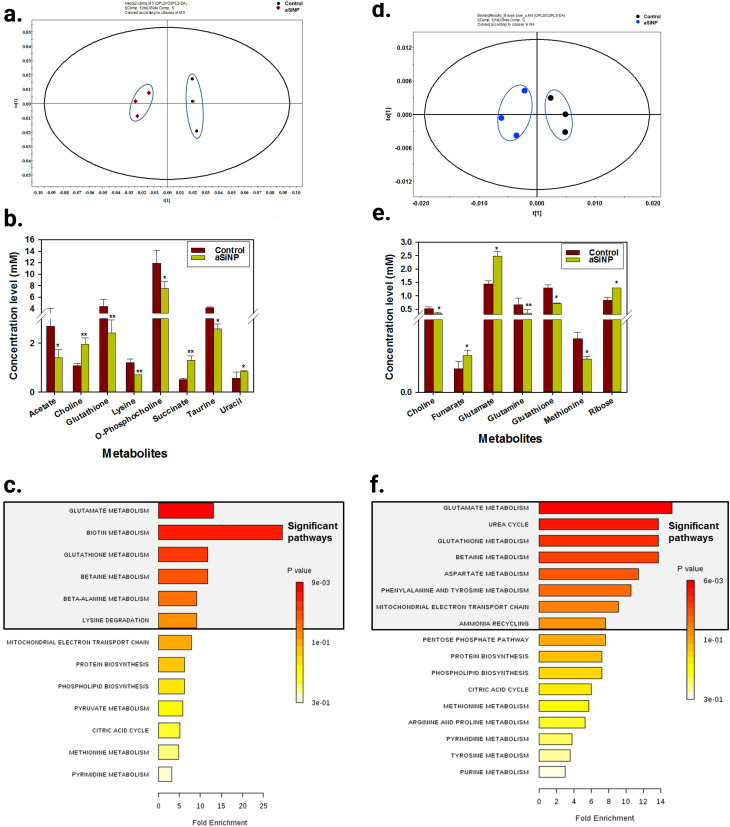
Fig. 14. Global metabolomics and pathway analysis in aSiO2 NP-exposed HepG2 cells (a–c) and Institute for Cancer Research (ICR) mice (d–f). OPLS-DA score plot from the NMR spectra of metabolomes from HepG2 cells treated with 100 mg L−1 aSiO2 NPs for 24 h (a) and from ICR mice liver treated with 50 mg kg−1 aSiO2 NPs for 24 h. Selected significantly altered global metabolites level in HepG2 cells (b) and in ICR mice liver (e) after treatment with the NPs. Pathway-based enrichment analysis performed by MetaboAnalyst 3.0 with significant altered metabolites (>1.5 fold) in HepG2 cells (c) and ICR mice liver (f) after treatment with the NPs. This figure has been reproduced from ref. 240 with permission from Elsevier B.V., Copyright 2018.

Fig. 14