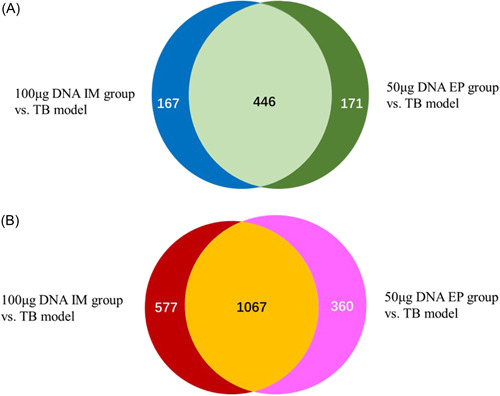
Figure 3.

The analysis of differentially expressed (DE) genes between 100 μg DNA intramuscular injection (IM) group and 50 μg DNA electroporation (EP) group. (A) The circle on the left represents the number of downregulated DE genes in the 100 μg DNA IM group versus tuberculosis (TB) model group and the circle on the right represents the number of downregulated DE genes in the 50 μg DNA EP group versus TB model group. The intersection part represents the number of the same DE genes between the two groups. (B) The circle on the left represents the number of upregulated DE genes in the 100 μg IM versus TB model group and the circle on the right represents the number of upregulated DE genes in the 50 μg DNA EP versus TB model group. The intersection part represents the number of the same DE genes between the two groups.
