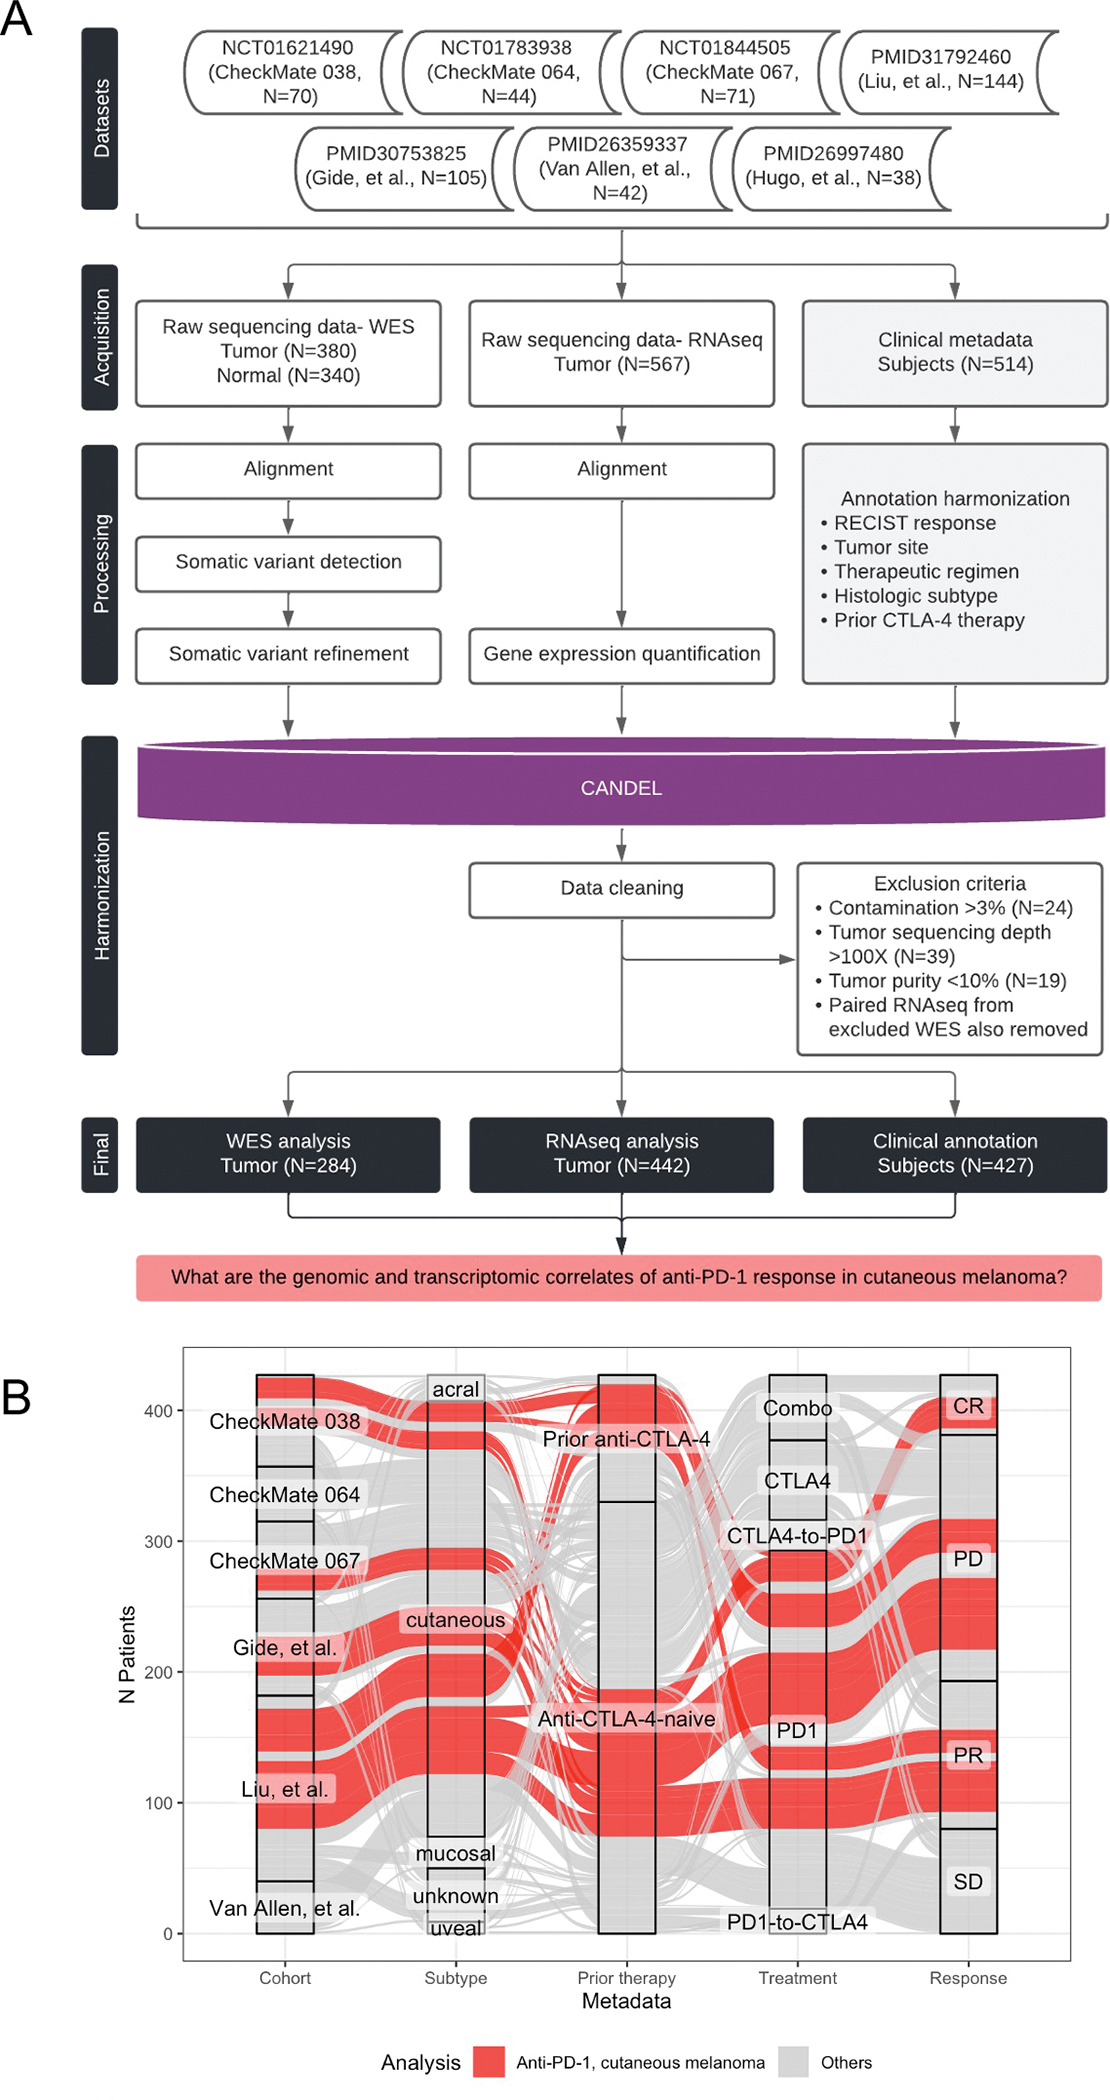
Figure 1. Project Overview.

(A) Overview of the datasets and pipeline for harmonized data processing and analysis. (B) Alluvial plot depicts the demographics of patients with melanoma tumor samples in the final dataset (x-axis; cohort, subtype, prior ICI therapy, treatment regimen, and RECIST response). Each individual (alluvium) is colored by whether the corresponding sample was included in analysis of cutaneous melanoma tumors treated with anti-PD-1. See Table 1 and Figure S1.
