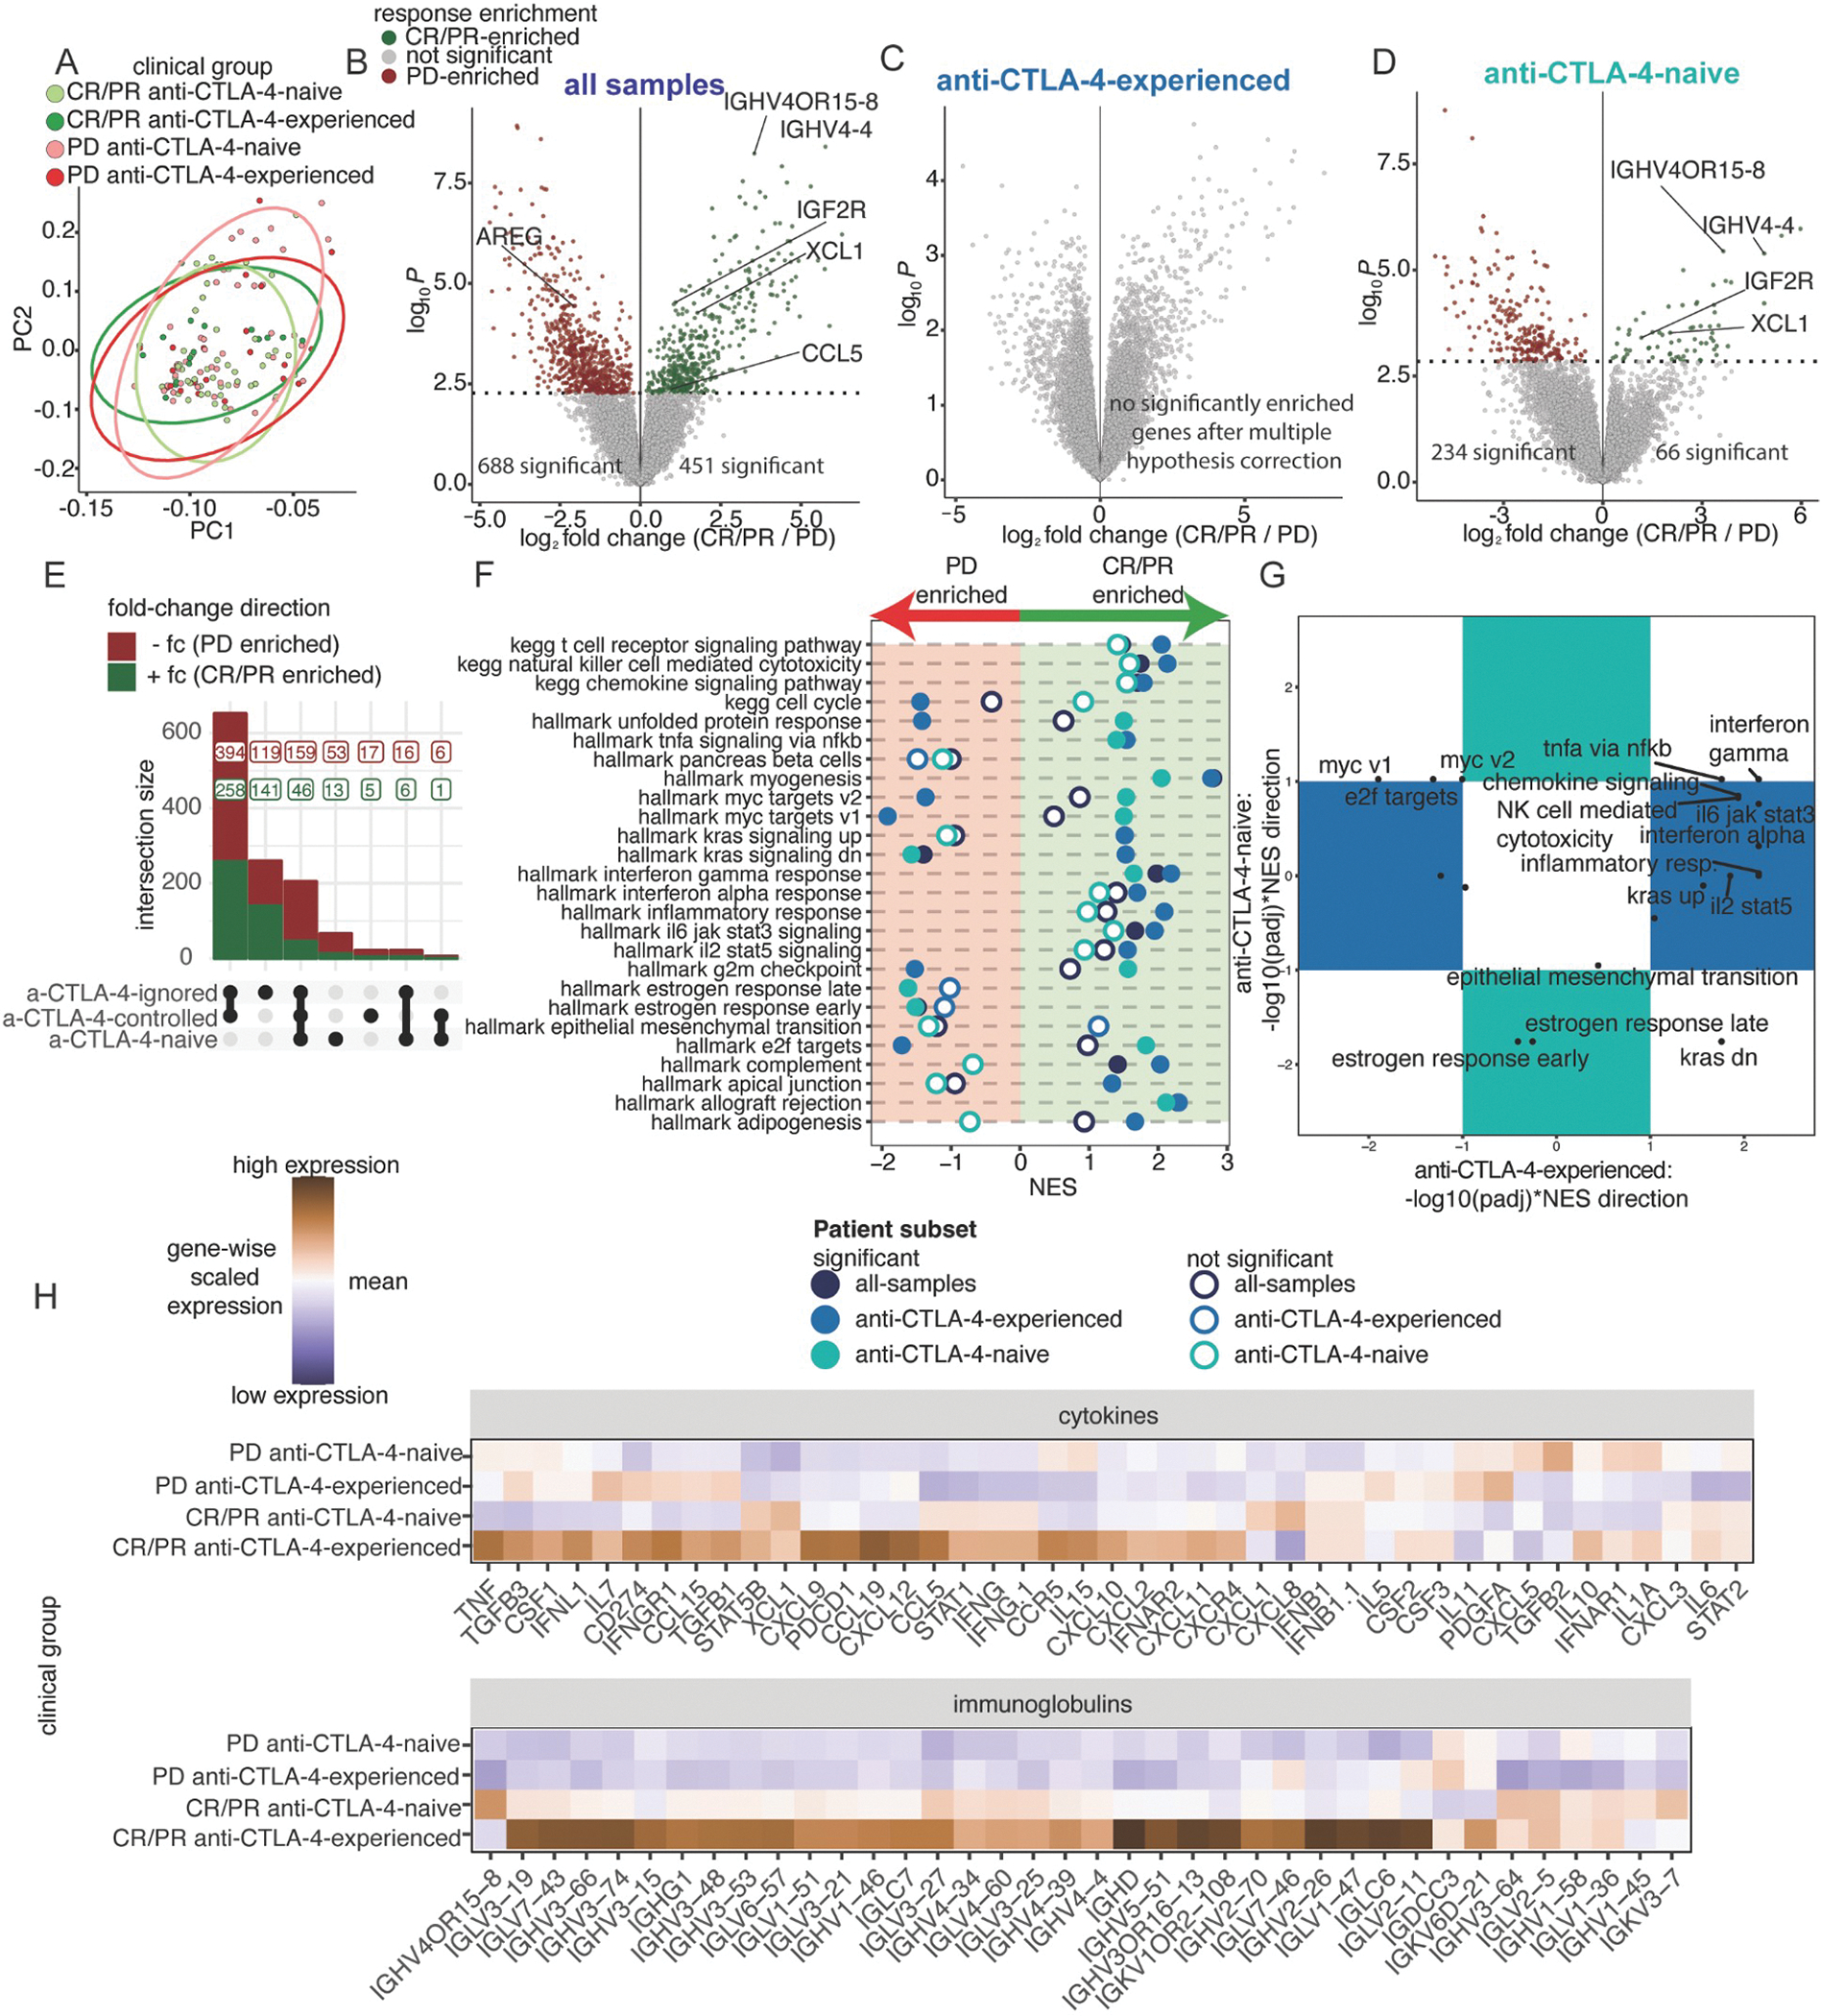
Figure 4. Strength of inflammatory gene expression patterns in anti-PD-1 responding biopsies is associated with anti-CTLA-4 experience.

(A) PC1 and PC2 from PCA of the top 15% most variable genes across 131 baseline, cutaneous melanoma samples, following batch effect correction by cohort. Colors indicate four clinical groups stratified across response and prior treatment. Ellipses indicate the distribution of clinical groups. (B-D) Differential expression analysis comparing tumors between CR/PR and PD patients across patient subsets: (B) all-samples (CR/PR=65, PD=66), (C) anti-CTLA-4-experienced-only (CR/PR=17, PD=22), and (D) anti-CTLA-4-naive-only (CR/PR=48, PD=44). (E) UpSet plot of differential genes comparing CR/PR to PD patients across each patient subset. (F) NES results from ranked-based GSEA of CR/PR versus PD patients in each patient subset. Hollow circles indicate no statistical significance. (G) Scatterplot of adjusted p-values with NES direction for GSEA results comparing CR/PR versus PD patients in the anti-CTLA-4-experienced and anti-CTLA-4-naive subsets. Pathways in the colored boxes indicate statistical significance in only the anti-CTLA-4-experienced or anti-CTLA-4-naive subset. (H) Heatmaps showing scaled mean expression of cytokine (top) and immunoglobulin-related genes (bottom). See Figure S3 and Tables S3–4.
