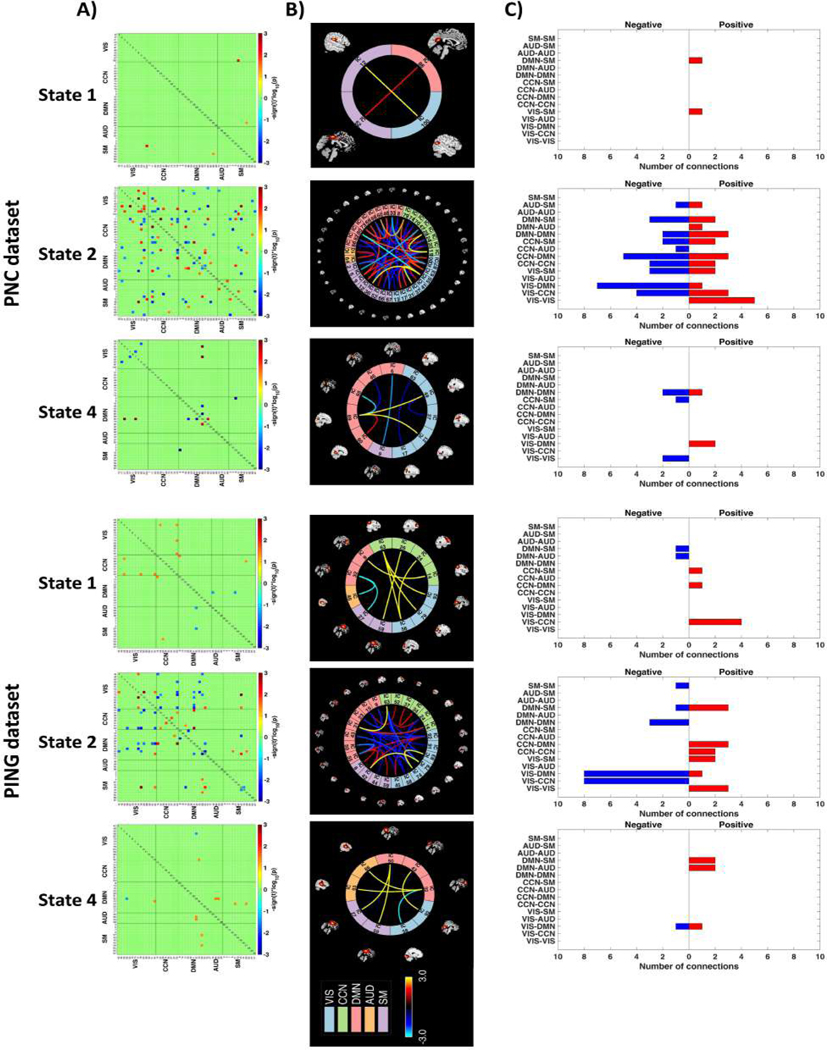
Fig. 5.
Differences in dynamic states. Group differences in dynamic FNC states were obtained by using a two-sample t-test between females and males for both the PNC and PING datasets. These variations were visualized by plotting the log of -value with the sign of statistics, . The red/blue cells have survived the Benjamini-Hochberg correction with a significant level of 0.05. To show these differences clearly, the variations were depicted with both (A) heatmap, (B) their corresponding brain connectome and (C) summary of connection amounts between functional brain networks. Note that only dynamic states with essential differences were displayed in this figure. For certain relationship between two networks within the (C) (such as VIS-CCN), if the number of positive connections is more than the negative ones, we believe that females possess stronger connectivity, and vice versa.

