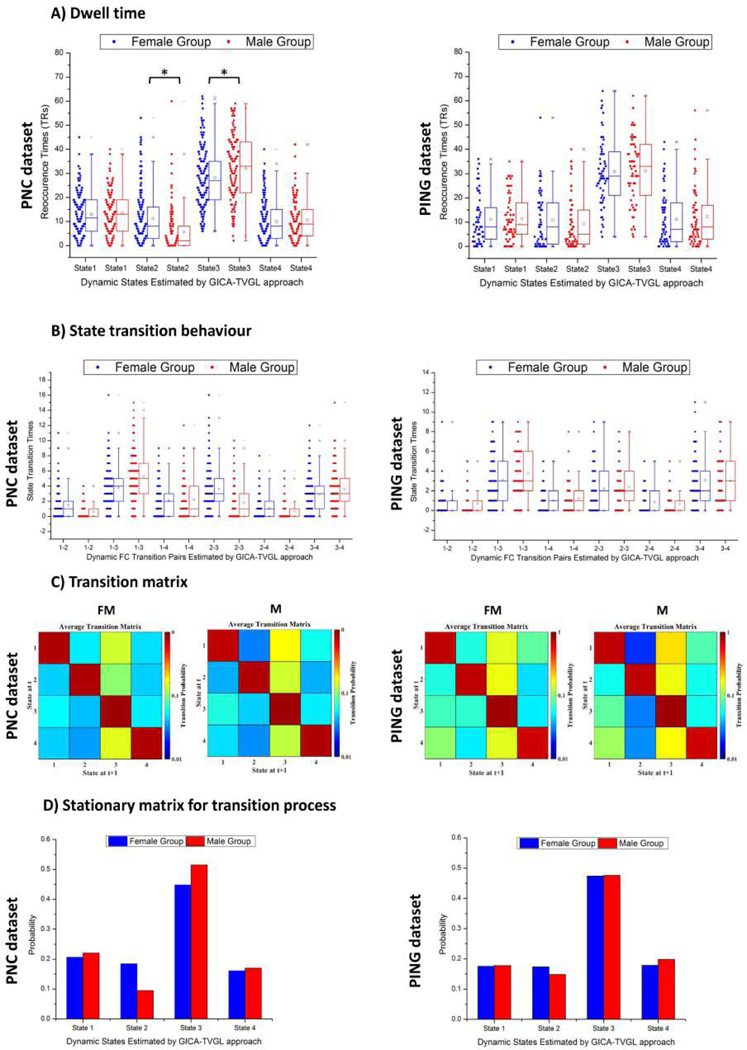
Fig. 6.
A) Dwell times represented by reoccurrence times of the dynamic functional connectivity states. Reoccurrence times of each individual in female and male group were presented in blue and red, respectively. Note that the symbol ’*’ means statistic significance (p-value=8.26e-7 for State 2 and p-value=4.7e-3 for State 3). B) Transition frequency of the dynamic functional connectivity states for two groups. The ticks on the horizontal axis indicate the state transition pairs, e.g., ”1−2” refers to the transition between state 1 and state 2. The state transition times of each individual in female and male were marked in blue and red, respectively. C) The state transition matrix for each group was averaged over subjects. Transition probability between two states ranging from 0 to 1 was on a log-scale in this map. D) Stationary matrices for transition matrices of the Markov chain shown in C). Note that the above analysis was performed on both the PNC and PING datasets.

