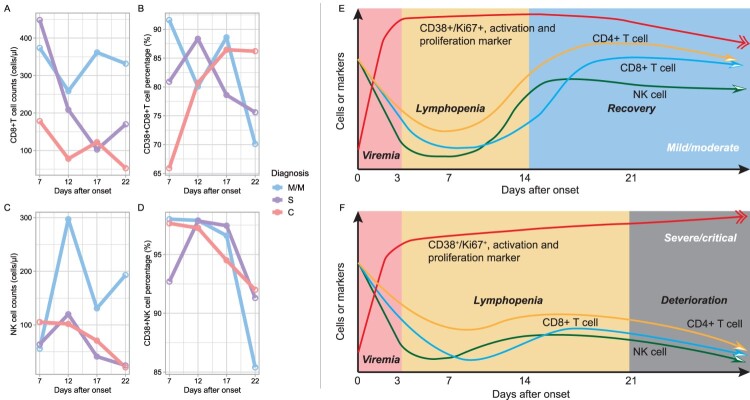
Figure 3.
Dynamics of immunophenotype at early stages of COVID-19. Figures A–D refer to the dynamics of counts and activations of CD8+ T cell and natural killer cells based on 66 individual lymphocyte subset data. Each time point was a median of data of 2 days before and after. Figures E-F were hypothesis models describing distinct immunopathology among mild, moderate, severe, and critical illnesses. M/M, mild or moderate illness; S, severe illness; C, critical illness.

