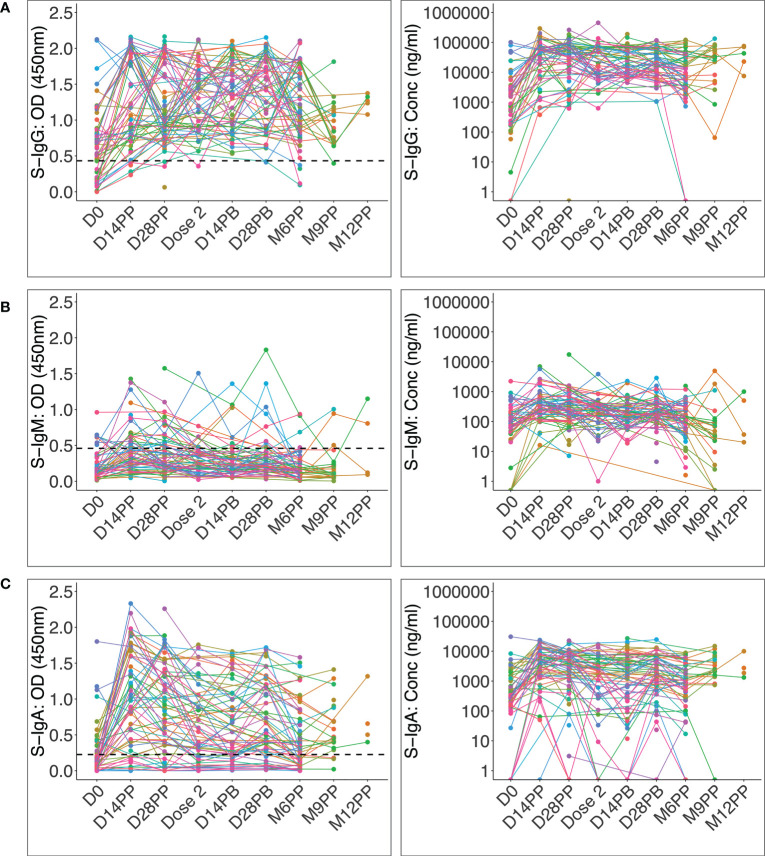
Figure 2.
Individual profile plots of spike-directed IgG, IgM and IgA antibody optical densities and concentrations after vaccination. Figure 2 shows the individual profile plots of spike-directed IgG (A), IgM (B), and IgA (C) antibody OD values (nm) and concentrations (ng/ml) over 12 months since the initial vaccination of individuals previously infected with mild or asymptomatic COVID-19. The dashed horizontal lines represent the cut-off points for antibody OD value seropositivity. The cut-offs for spike-directed IgG, IgM, and IgA seropositivity were 0.432, 0.459 and 0.226, respectively.

