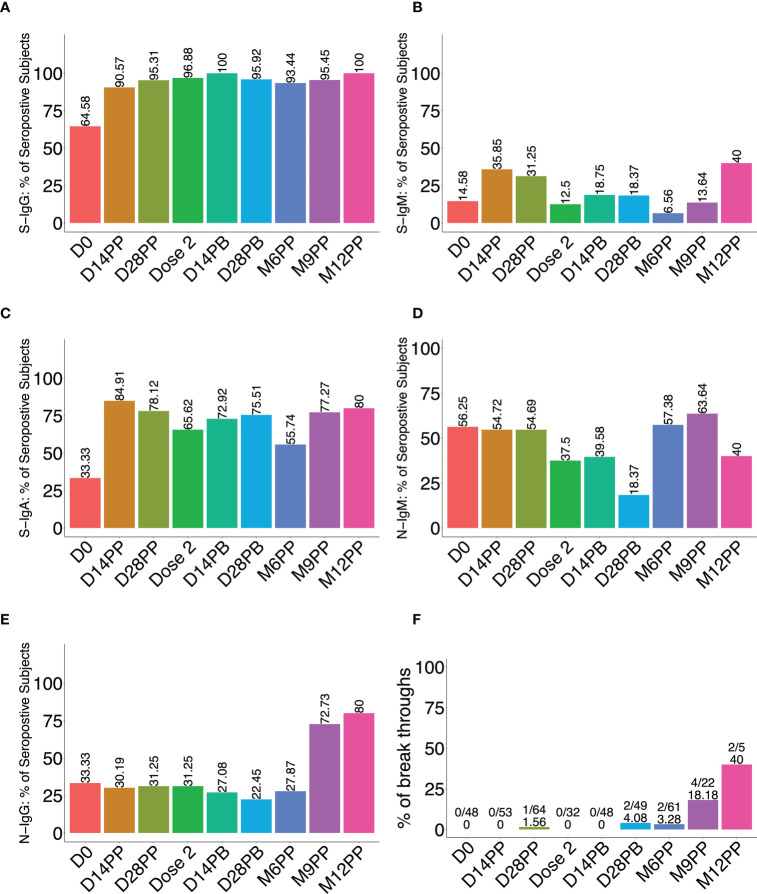
Figure 3.
Percentage of seropositive participants following vaccination. Figure 3 illustrates the proportion (%) of participants with spike-directed IgG (A), IgM (B), IgA (C), and anti-nucleoprotein IgM (D) ad IgG (E) antibodies at various follow-up time points after vaccination (x-axis). (F) is a bar graph depicting the proportion of breakthrough subjects, defined as those who experienced an 11-fold increase in the concentration of nucleoprotein-directed IgG antibodies at each time point.

