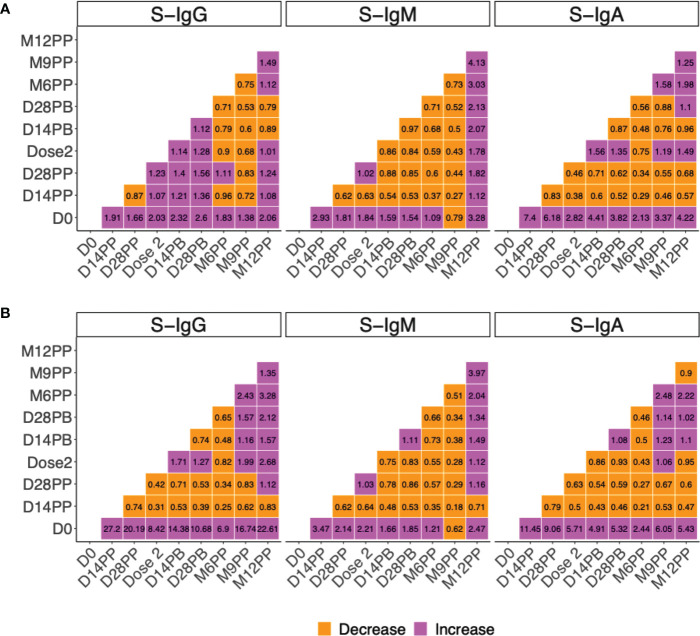
Figure 6.
Median fold change in in spike-directed antibody levels over time. Figure 6 summarises the fold change in spike-directed IgG, IgM and IgA antibody OD values (A) and concentrations (B) across the different specimen collection time points. The heat map shows the extent of change (increase or decrease) in vaccine-induced antibody response over time. The change between time points is shown with each cell indicating an increase or decrease between any two timepoints at the x and y axis. Fold change between 0 to 1 indicate a decrease (orange), Fold change of 1 indicates no change while fold change greater than 1 indicate an increase (purple).

