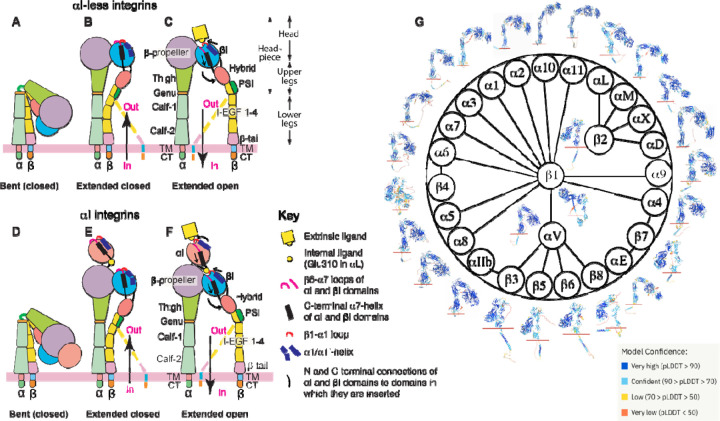
Figure 1. Integrin domain organization and structures predicted by AlphaFold2.
(A-F) Integrin domain organization and conformational changes during activation are depicted for both αI-less (A-C) and αI-containing (D-F) integrins. The figures illustrate global and local structural changes, with dashed lines representing alternative conformations of the β leg domains. (G) The integrin family and overall structures of α and β subunits predicted by AlphaFold2 are displayed, with the red line marketing the boundary between the extracellular and transmembrane (TM) domains. The structure images are color-coded based on model confidence calculated as pLDDT scores.

