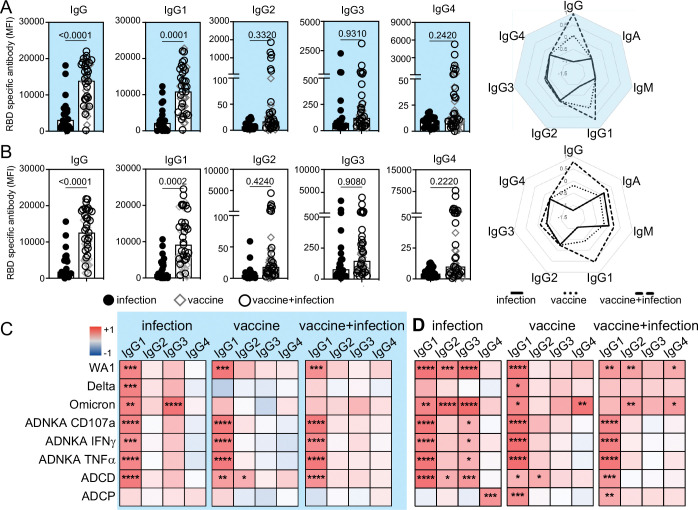
Figure 4:
Vaccination in pregnancy enhances RBD IgG1. The magnitude of RBD-specific total IgG and subclasses in (A) cord and (B) maternal responses are shown. P-values are adjusted for maternal age and body mass index using linear regression. Radar plots summarize the magnitude of RBD-specific isotype and subclass. Each line represents the median Z-scored data for each clinical group (infection n=20, vaccine n=18, vaccine+infection n=27). Heatmaps of the regression coefficients (r2) summarize the dependency of RBD-specific antibody functions on subclasses in cord (C) and maternal (D) samples by simple linear regression. * p≤0.05; ** p≤0.01; *** p≤0.001; **** p≤0.0001.

