Figure 1:

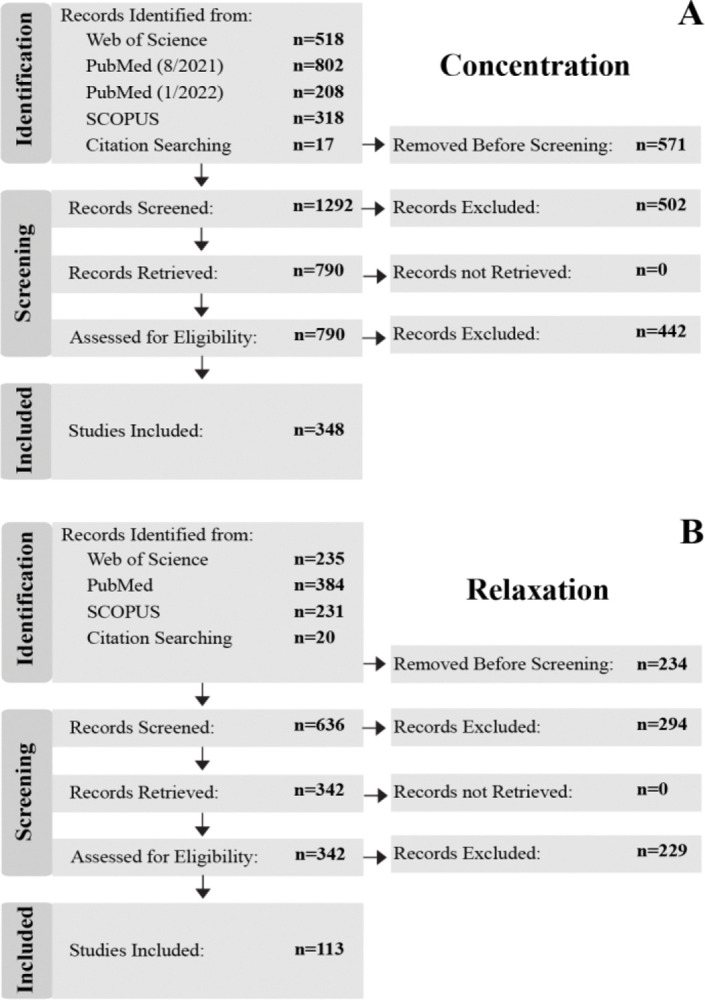
PRISMA flow charts that show the database selection and inclusion process of the (A) concentration and (B) T2 relaxation publications.

PRISMA flow charts that show the database selection and inclusion process of the (A) concentration and (B) T2 relaxation publications.