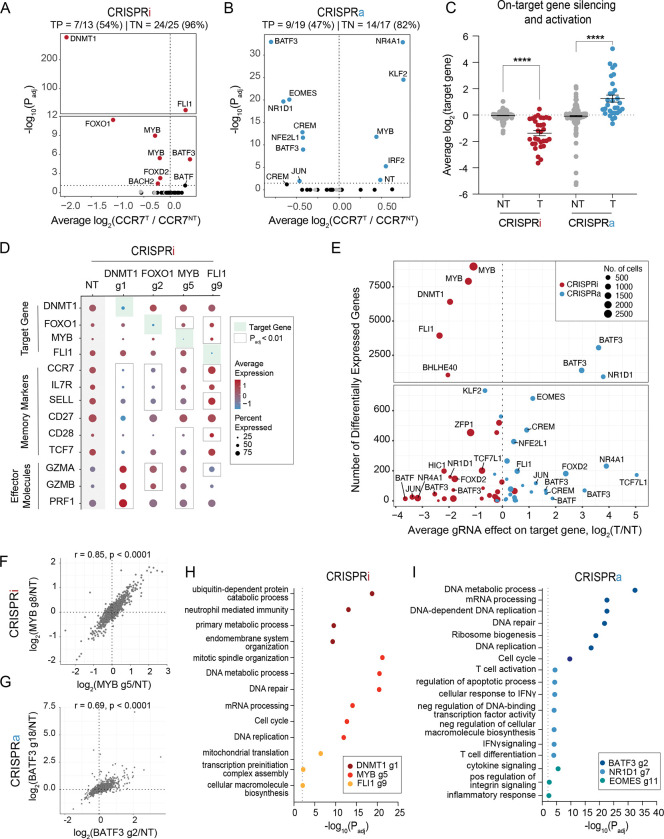
Figure 3. Single cell RNA-sequencing characterization of gene candidates.
Volcano plots of significance (Padj) versus average fold change of CCR7 expression for each gRNA compared to non-perturbed cells for (A) CRISPRi and (B) CRISPRa perturbations. Red and blue data points indicate gRNA hits (Padj < 0.05). Gray data points indicate NT gRNAs. True positive and negative rates are displayed above each volcano plot.
(C) Average fold change in target gene expression for non-targeting gRNAs and targeting gRNAs across CRISPRi and CRISPRa perturbations. A two-way ANOVA with Tukey’s post hoc test was used to compare the fold change in target gene expression between groups.
(D) Dot plot depicting the average expression and percent of cells expressing target genes, memory markers, and effector molecules for the indicated CRISPRi perturbations. (E) Scatter plot of the number of differentially expressed genes (DEGs defined as Padj < 0.01) associated with each gRNA versus the gRNA effect on the target gene for both CRISPRi and CRISPRa perturbations.
(F) Correlation of the union set of DEGs between the top CRISPRi MYB gRNAs.
(G) Correlation of the union set of DEGs between the top CRISPRa BATF3 gRNAs. Representative enriched pathways for the top three (H) CRISPRi and (I) CRISPRa gRNAs.

