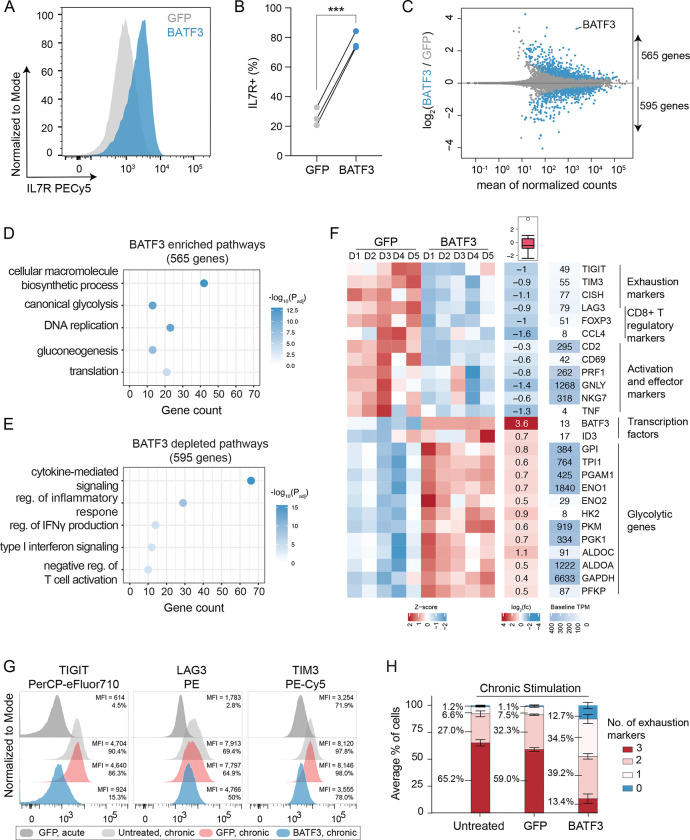
Figure 4. BATF3 overexpression promotes specific features of memory T cells and counters exhaustion and cytotoxic gene signatures.
(A) Representative histogram of IL7R expression in CD8+ T cells with or without BATF3 overexpression on day 8 post transduction.
(B) Summary statistics of IL7R expression with or without BATF3 overexpression (n = 3 individual donors, paired t test was used to compare IL7R expression between groups, lines connect the same donor).
(C) Differential gene expression analysis between CD8+ T cells with or without BATF3 overexpression on day 10 post transduction. Blue data points indicate differentially expressed genes (DEGs, Padj < 0.01, n = 5 donors).
(D) Selected enriched and (E) depleted biological processes from BATF3 overexpression.
(F) Heatmap of DEGs related to T cell exhaustion, regulatory function, cytotoxicity, transcriptional activity, and glycolysis.
(G) Representative histograms of exhaustion markers (TIGIT, LAG3, and TIM3) on day 12 after acute or chronic stimulation across groups.
(H) Stacked bar chart with average percentage of CD8+ T cells positive for 0, 1, 2, or 3 exhaustion markers (TIGIT, LAG3, TIM3) on day 12 after chronic stimulation across groups (n = 3 independent donors, error bars represent SEM).

